OPEN-SOURCE SCRIPT
업데이트됨 Rolling CAGR
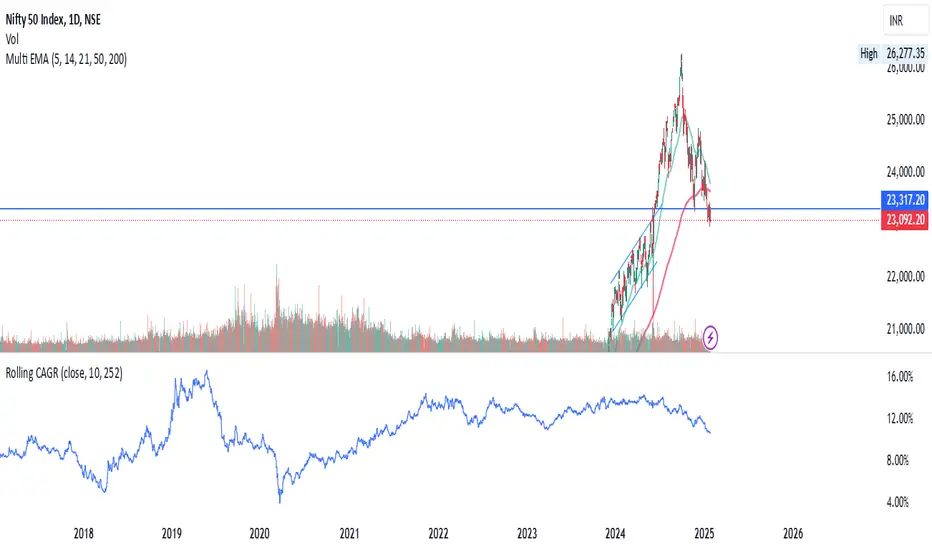
Rolling CAGR (Compound Annual Growth Rate) Indicator
This indicator calculates and plots the rolling Compound Annual Growth Rate (CAGR) for any selected data source. CAGR represents the mean annual growth rate of an investment over a specified time period, taking into account the effect of compounding.
Features:
• Customizable data source (default: close price)
• Adjustable time period in years
• Configurable trading days per year (252 for stocks, 365 for crypto)
• Results displayed as percentage values
• Works on daily timeframes
Input Parameters:
• Data Source: Select the price or indicator data to analyze
• Number of Years: Set the lookback period for CAGR calculation
• Trading Days in a Year: Adjust based on market type (252 for stocks, 365 for crypto)
Usage:
Perfect for analyzing long-term growth rates and comparing investment performance across different periods. The indicator provides a rolling view of compound growth, helping traders and investors understand the sustained growth rate of an asset over their chosen timeframe.
Note: This indicator is designed for daily timeframes as CAGR calculations are most meaningful over longer periods.
Formula Used:
CAGR = (End Value / Start Value)^(1/number of years) - 1
릴리즈 노트
Rolling CAGR (Compound Annual Growth Rate) IndicatorThis indicator calculates and plots the rolling Compound Annual Growth Rate (CAGR) for any selected data source. CAGR represents the mean annual growth rate of an investment over a specified time period, taking into account the effect of compounding.
Features:
• Customizable data source (default: close price)
• Adjustable time period in years
• Configurable trading days per year (252 for stocks, 365 for crypto)
• Results displayed as percentage values
• Works on daily timeframes
Input Parameters:
• Data Source: Select the price or indicator data to analyze
• Number of Years: Set the lookback period for CAGR calculation
• Trading Days in a Year: Adjust based on market type (252 for stocks, 365 for crypto)
Usage:
Perfect for analyzing long-term growth rates and comparing investment performance across different periods. The indicator provides a rolling view of compound growth, helping traders and investors understand the sustained growth rate of an asset over their chosen timeframe.
Note: This indicator is designed for daily timeframes as CAGR calculations are most meaningful over longer periods.
Formula Used:
CAGR = (End Value / Start Value)^(1/number of years) - 1
오픈 소스 스크립트
트레이딩뷰의 진정한 정신에 따라, 이 스크립트의 작성자는 이를 오픈소스로 공개하여 트레이더들이 기능을 검토하고 검증할 수 있도록 했습니다. 작성자에게 찬사를 보냅니다! 이 코드는 무료로 사용할 수 있지만, 코드를 재게시하는 경우 하우스 룰이 적용된다는 점을 기억하세요.
면책사항
해당 정보와 게시물은 금융, 투자, 트레이딩 또는 기타 유형의 조언이나 권장 사항으로 간주되지 않으며, 트레이딩뷰에서 제공하거나 보증하는 것이 아닙니다. 자세한 내용은 이용 약관을 참조하세요.
오픈 소스 스크립트
트레이딩뷰의 진정한 정신에 따라, 이 스크립트의 작성자는 이를 오픈소스로 공개하여 트레이더들이 기능을 검토하고 검증할 수 있도록 했습니다. 작성자에게 찬사를 보냅니다! 이 코드는 무료로 사용할 수 있지만, 코드를 재게시하는 경우 하우스 룰이 적용된다는 점을 기억하세요.
면책사항
해당 정보와 게시물은 금융, 투자, 트레이딩 또는 기타 유형의 조언이나 권장 사항으로 간주되지 않으며, 트레이딩뷰에서 제공하거나 보증하는 것이 아닙니다. 자세한 내용은 이용 약관을 참조하세요.