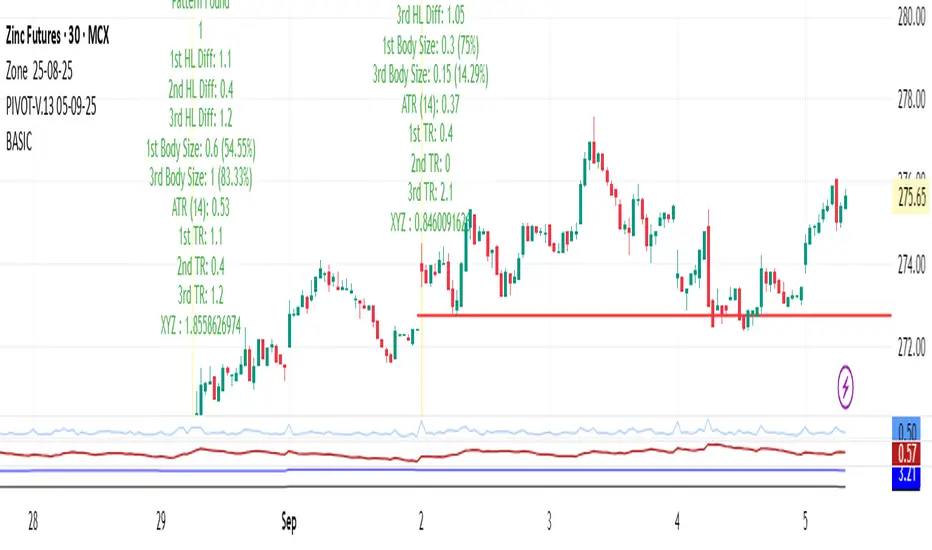
INVITE-ONLY SCRIPT
BASIC

You want a clear explanation of chart patterns (the shapes/structures price makes on charts) that traders use to identify possible future price movements. Let me break them down into two big groups:
---
📊 1. Continuation Patterns
👉 These suggest that the current trend (uptrend or downtrend) will likely continue.
🔹 Flag
Bull Flag → Appears in an uptrend. Sharp upward move (flagpole) followed by a small downward/sideways channel (the flag).
Bear Flag → Opposite, in a downtrend.
📌 Meaning: After the flag consolidation, price usually continues in the original direction.
---
🔹 Pennant
Small symmetrical triangle after a strong move.
Shows temporary pause before trend continuation.
📌 Meaning: Breakout usually follows in the direction of the main trend.
---
🔹 Rectangle
Price moves between parallel support & resistance levels.
Breakout usually happens in the direction of the prevailing trend.
---
📊 2. Reversal Patterns
👉 These suggest that the current trend may reverse direction.
🔹 Head & Shoulders
Looks like a head with two shoulders.
Head & Shoulders Top → Reversal from uptrend to downtrend.
Inverse Head & Shoulders → Reversal from downtrend to uptrend.
📌 Key Level: The “neckline” → breakout confirms reversal.
---
🔹 Double Top & Double Bottom
Double Top → Price tests resistance twice but fails, bearish reversal.
Double Bottom → Price tests support twice but fails, bullish reversal.
---
🔹 Triple Top & Triple Bottom
Same as double but with three tests. Stronger reversal signal.
---
🔹 Rounding Bottom (Saucer)
Price gradually shifts from downtrend to uptrend, looks like a "U" shape.
Very reliable for long-term reversals.
---
📊 3. Neutral / Indecision Patterns
👉 These show uncertainty – direction is confirmed only after breakout.
🔹 Symmetrical Triangle
Price makes lower highs & higher lows (converging).
Breakout can happen either side.
🔹 Ascending Triangle
Flat resistance at top, higher lows forming.
Usually bullish breakout.
🔹 Descending Triangle
Flat support at bottom, lower highs forming.
Usually bearish breakout.
---
✅ Summary for traders:
Continuation = Flag, Pennant, Rectangle.
Reversal = Head & Shoulders, Double/Triple Tops & Bottoms, Rounding Bottom.
Neutral/Indecision = Triangles.
---
Would you like me to make a visual chart image with all these patterns drawn, so you can see how they look on real candlesticks?
---
📊 1. Continuation Patterns
👉 These suggest that the current trend (uptrend or downtrend) will likely continue.
🔹 Flag
Bull Flag → Appears in an uptrend. Sharp upward move (flagpole) followed by a small downward/sideways channel (the flag).
Bear Flag → Opposite, in a downtrend.
📌 Meaning: After the flag consolidation, price usually continues in the original direction.
---
🔹 Pennant
Small symmetrical triangle after a strong move.
Shows temporary pause before trend continuation.
📌 Meaning: Breakout usually follows in the direction of the main trend.
---
🔹 Rectangle
Price moves between parallel support & resistance levels.
Breakout usually happens in the direction of the prevailing trend.
---
📊 2. Reversal Patterns
👉 These suggest that the current trend may reverse direction.
🔹 Head & Shoulders
Looks like a head with two shoulders.
Head & Shoulders Top → Reversal from uptrend to downtrend.
Inverse Head & Shoulders → Reversal from downtrend to uptrend.
📌 Key Level: The “neckline” → breakout confirms reversal.
---
🔹 Double Top & Double Bottom
Double Top → Price tests resistance twice but fails, bearish reversal.
Double Bottom → Price tests support twice but fails, bullish reversal.
---
🔹 Triple Top & Triple Bottom
Same as double but with three tests. Stronger reversal signal.
---
🔹 Rounding Bottom (Saucer)
Price gradually shifts from downtrend to uptrend, looks like a "U" shape.
Very reliable for long-term reversals.
---
📊 3. Neutral / Indecision Patterns
👉 These show uncertainty – direction is confirmed only after breakout.
🔹 Symmetrical Triangle
Price makes lower highs & higher lows (converging).
Breakout can happen either side.
🔹 Ascending Triangle
Flat resistance at top, higher lows forming.
Usually bullish breakout.
🔹 Descending Triangle
Flat support at bottom, lower highs forming.
Usually bearish breakout.
---
✅ Summary for traders:
Continuation = Flag, Pennant, Rectangle.
Reversal = Head & Shoulders, Double/Triple Tops & Bottoms, Rounding Bottom.
Neutral/Indecision = Triangles.
---
Would you like me to make a visual chart image with all these patterns drawn, so you can see how they look on real candlesticks?
초대 전용 스크립트
이 스크립트는 작성자가 승인한 사용자만 접근할 수 있습니다. 사용하려면 요청을 보내고 승인을 받아야 합니다. 일반적으로 결제 후에 승인이 이루어집니다. 자세한 내용은 아래 작성자의 지침을 따르거나 jatingajjar75에게 직접 문의하세요.
트레이딩뷰는 스크립트 작성자를 완전히 신뢰하고 스크립트 작동 방식을 이해하지 않는 한 스크립트 비용을 지불하거나 사용하지 않는 것을 권장하지 않습니다. 무료 오픈소스 대체 스크립트는 커뮤니티 스크립트에서 찾을 수 있습니다.
작성자 지시 사항
The provided text indicates that the script in question is an "invite-only" script, likely on a platform like TradingView, and access is restricted to users authorized by the author, john joshi@gmail.com, This typically involves a payment and requires dir
면책사항
이 정보와 게시물은 TradingView에서 제공하거나 보증하는 금융, 투자, 거래 또는 기타 유형의 조언이나 권고 사항을 의미하거나 구성하지 않습니다. 자세한 내용은 이용 약관을 참고하세요.