PROTECTED SOURCE SCRIPT
OB EMA Fibo Tunnel
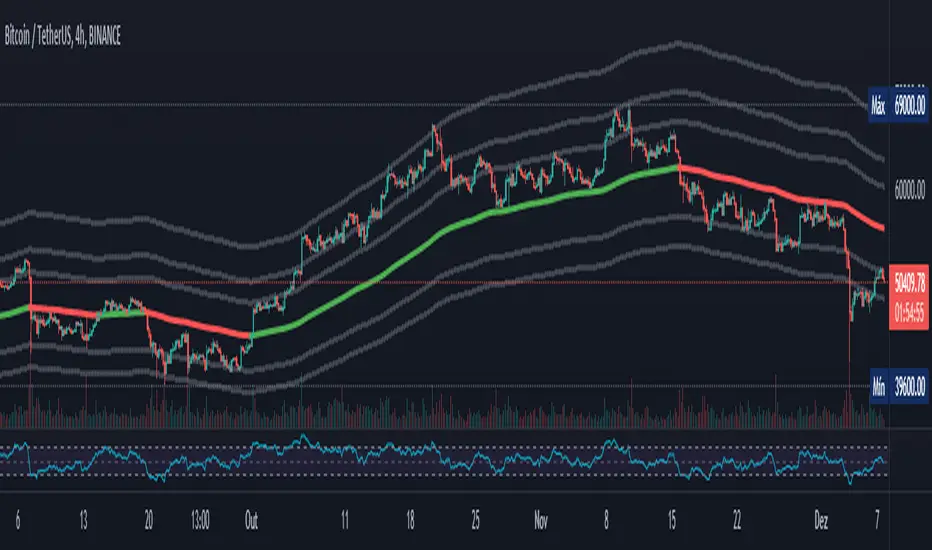
This indicator plots a base EMA and then plot many lines above and below according to the Fibonacci levels, creating a tunnel where it is possible to see the price respecting some levels.
It is similar the concept of Vegas Tunnel, but with my numbers.
The Base EMA is 26 for daily charts and 8 for Weekly charts. The smaller timeframes use a variation of 26, like 26*4 for 4h charts.
It is also possible to choose if you want to color candle bars and what levels of Fibo lines you want to see. I created that to have a clean chart.
*** To enable the colored candles, you should choose the visual order and move to top!
Please leave a comment if you liked and if you have any suggestion.
보호된 스크립트입니다
이 스크립트는 비공개 소스로 게시됩니다. 하지만 이를 자유롭게 제한 없이 사용할 수 있습니다 – 자세한 내용은 여기에서 확인하세요.
면책사항
해당 정보와 게시물은 금융, 투자, 트레이딩 또는 기타 유형의 조언이나 권장 사항으로 간주되지 않으며, 트레이딩뷰에서 제공하거나 보증하는 것이 아닙니다. 자세한 내용은 이용 약관을 참조하세요.
보호된 스크립트입니다
이 스크립트는 비공개 소스로 게시됩니다. 하지만 이를 자유롭게 제한 없이 사용할 수 있습니다 – 자세한 내용은 여기에서 확인하세요.
면책사항
해당 정보와 게시물은 금융, 투자, 트레이딩 또는 기타 유형의 조언이나 권장 사항으로 간주되지 않으며, 트레이딩뷰에서 제공하거나 보증하는 것이 아닙니다. 자세한 내용은 이용 약관을 참조하세요.