INVITE-ONLY SCRIPT
TIL Trend Navigator
Trading Indicator Lab’s Trend Navigator for TradingView is an indicator that can help you reveal the underlying trends in any chart on any timeframe.
Determining Trends
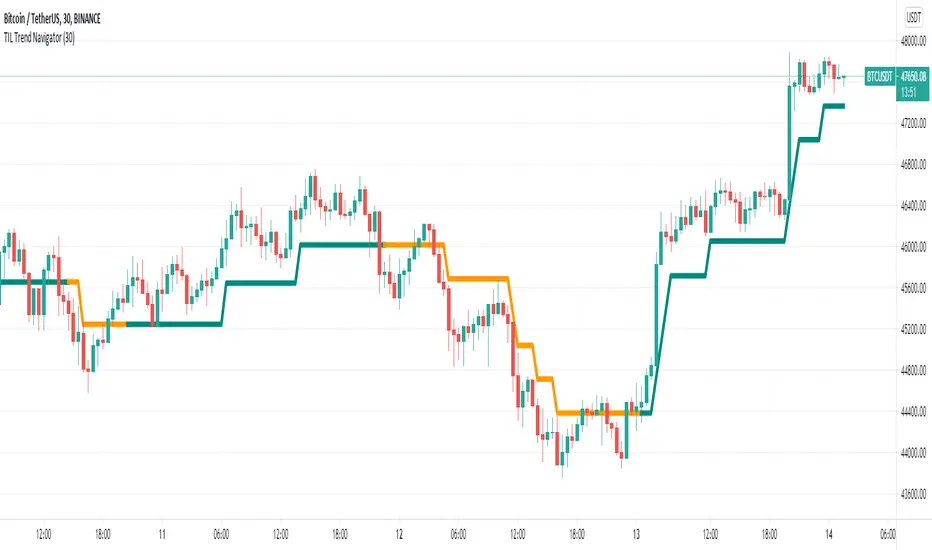
It only takes a minute or two to analyze the indicator with its simple yet insightful methods of representing bullish, bearish and ranging price action across the chart. It forms a single line that runs in 3 directions:
- Upward direction – represents a significant bullish price action
- Horizontal direction – represents ranging price action or consolidation
- Downward direction – represents a significant bearish price action
The indicator borrows the concept of Renko charts where upward and downward price action are shown to move at a single identical angle. This makes the indicator more intuitive and easier to read.
Support and Resistance
That’s not all. The Trend Navigator can also serve as a support or resistance line at any given point in the bar history. This is distinguished with the dual colors of the lines which alternates at each segment:
- Support segment (green) – the segment acts as support where price moves above the line
- Resistance segment (orange) – the segment acts as resistance where price moves below the line
Breakouts occur when the bar crosses above or below the Trend Navigator, at which point, its line changes color to signal the change of its role as a support or resistance level.
Available Alert Conditions
- Cross – triggers when price crosses the Trend Navigator
- Soar – triggers when majority of the bar’s body crosses above the Trend Navigator
- Plummet – triggers when majority of the bar’s body crosses below the Trend Navigator
- Uptrend – triggers when a new uptrend is detected
- Downtrend – triggers when a new downtrend is detected
- Ranging – triggers when a new ranging price action is detected
- Trend Reversal – triggers when either an uptrend or downtrend is detected
Inputs
- Length – sets the number of bars the indicator analyzes at each execution
- Support Segment Color – allows the user to change the color of the support segments. Its default color is green
- Resistance Segment Color – allows the user to change the color of the resistance segments. Its default color is orange
Determining Trends
It only takes a minute or two to analyze the indicator with its simple yet insightful methods of representing bullish, bearish and ranging price action across the chart. It forms a single line that runs in 3 directions:
- Upward direction – represents a significant bullish price action
- Horizontal direction – represents ranging price action or consolidation
- Downward direction – represents a significant bearish price action
The indicator borrows the concept of Renko charts where upward and downward price action are shown to move at a single identical angle. This makes the indicator more intuitive and easier to read.
Support and Resistance
That’s not all. The Trend Navigator can also serve as a support or resistance line at any given point in the bar history. This is distinguished with the dual colors of the lines which alternates at each segment:
- Support segment (green) – the segment acts as support where price moves above the line
- Resistance segment (orange) – the segment acts as resistance where price moves below the line
Breakouts occur when the bar crosses above or below the Trend Navigator, at which point, its line changes color to signal the change of its role as a support or resistance level.
Available Alert Conditions
- Cross – triggers when price crosses the Trend Navigator
- Soar – triggers when majority of the bar’s body crosses above the Trend Navigator
- Plummet – triggers when majority of the bar’s body crosses below the Trend Navigator
- Uptrend – triggers when a new uptrend is detected
- Downtrend – triggers when a new downtrend is detected
- Ranging – triggers when a new ranging price action is detected
- Trend Reversal – triggers when either an uptrend or downtrend is detected
Inputs
- Length – sets the number of bars the indicator analyzes at each execution
- Support Segment Color – allows the user to change the color of the support segments. Its default color is green
- Resistance Segment Color – allows the user to change the color of the resistance segments. Its default color is orange
초대 전용 스크립트
이 스크립트는 작성자가 승인한 사용자만 접근할 수 있습니다. 사용하려면 요청 후 승인을 받아야 하며, 일반적으로 결제 후에 허가가 부여됩니다. 자세한 내용은 아래 작성자의 안내를 따르거나 tradingindicatorlab에게 직접 문의하세요.
트레이딩뷰는 스크립트의 작동 방식을 충분히 이해하고 작성자를 완전히 신뢰하지 않는 이상, 해당 스크립트에 비용을 지불하거나 사용하는 것을 권장하지 않습니다. 커뮤니티 스크립트에서 무료 오픈소스 대안을 찾아보실 수도 있습니다.
작성자 지시 사항
Please feel free to send us a private message here on TradingView to gain access to this indicator.
면책사항
해당 정보와 게시물은 금융, 투자, 트레이딩 또는 기타 유형의 조언이나 권장 사항으로 간주되지 않으며, 트레이딩뷰에서 제공하거나 보증하는 것이 아닙니다. 자세한 내용은 이용 약관을 참조하세요.