OPEN-SOURCE SCRIPT
Anchored Average Price by Atilla Yurtseven (AAP)
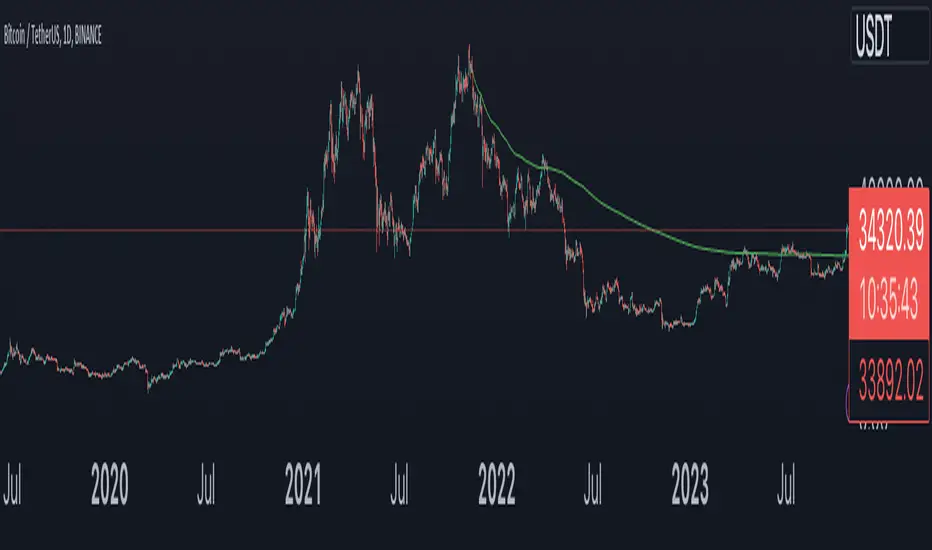
Anchored Average Price indicator is designed to pinpoint a specific date and price in a given financial instrument's price chart. Once anchored to the desired date and price level, the script calculates and displays the average price from that anchor point to the current day.
Features
Code Mechanics
By incorporating these features and mechanics, AAP provides traders and investors with a powerful tool for assessing average prices anchored to a specific date or swing.
Disclaimer:
This TradingView script is intended for educational and informational purposes only and should not be considered as investment or trading advice. Past performance is not indicative of future results. Trading and investing carry a high level of risk, and you should consult with a qualified financial advisor before making any financial decisions. The creator of this script, Atilla Yurtseven, is not responsible for any losses or damages incurred as a result of using this script.
Trade smart, stay safe
Atilla Yurtseven
Features
- Customizable Source: Allows users to choose the source data for calculations. By default, it uses hlc3, which is the average of high, low, and close prices.
- Start Date Input: The script includes a timestamp-based input that allows the user to specify the anchor date easily.
- Customizable Color: Users can change the color of the plotted average line, adding an additional layer of customization to the visual representation.
Code Mechanics
- Initialization: Declares the variables and arrays required for calculations and display. The array is used to store price data.
- Condition Check: Only starts storing and calculating data if the chart's time is equal to or greater than the user-defined start date.
- Data Storing: Once the condition is met, the script pushes the src price data into the array for future averaging.
- Average Calculation: It calculates the average price of the values stored in the array.
- Data Clearing: If the condition is not met, the array is cleared, and no average is plotted.
- Plotting: The average price is plotted on the chart with the user-defined color.
By incorporating these features and mechanics, AAP provides traders and investors with a powerful tool for assessing average prices anchored to a specific date or swing.
Disclaimer:
This TradingView script is intended for educational and informational purposes only and should not be considered as investment or trading advice. Past performance is not indicative of future results. Trading and investing carry a high level of risk, and you should consult with a qualified financial advisor before making any financial decisions. The creator of this script, Atilla Yurtseven, is not responsible for any losses or damages incurred as a result of using this script.
Trade smart, stay safe
Atilla Yurtseven
오픈 소스 스크립트
트레이딩뷰의 진정한 정신에 따라, 이 스크립트의 작성자는 이를 오픈소스로 공개하여 트레이더들이 기능을 검토하고 검증할 수 있도록 했습니다. 작성자에게 찬사를 보냅니다! 이 코드는 무료로 사용할 수 있지만, 코드를 재게시하는 경우 하우스 룰이 적용된다는 점을 기억하세요.
I know Kung-Fu!
면책사항
해당 정보와 게시물은 금융, 투자, 트레이딩 또는 기타 유형의 조언이나 권장 사항으로 간주되지 않으며, 트레이딩뷰에서 제공하거나 보증하는 것이 아닙니다. 자세한 내용은 이용 약관을 참조하세요.
오픈 소스 스크립트
트레이딩뷰의 진정한 정신에 따라, 이 스크립트의 작성자는 이를 오픈소스로 공개하여 트레이더들이 기능을 검토하고 검증할 수 있도록 했습니다. 작성자에게 찬사를 보냅니다! 이 코드는 무료로 사용할 수 있지만, 코드를 재게시하는 경우 하우스 룰이 적용된다는 점을 기억하세요.
I know Kung-Fu!
면책사항
해당 정보와 게시물은 금융, 투자, 트레이딩 또는 기타 유형의 조언이나 권장 사항으로 간주되지 않으며, 트레이딩뷰에서 제공하거나 보증하는 것이 아닙니다. 자세한 내용은 이용 약관을 참조하세요.