PROTECTED SOURCE SCRIPT
업데이트됨 Sangana beta table
Ideal to use this indicator in Monthly timeframe.
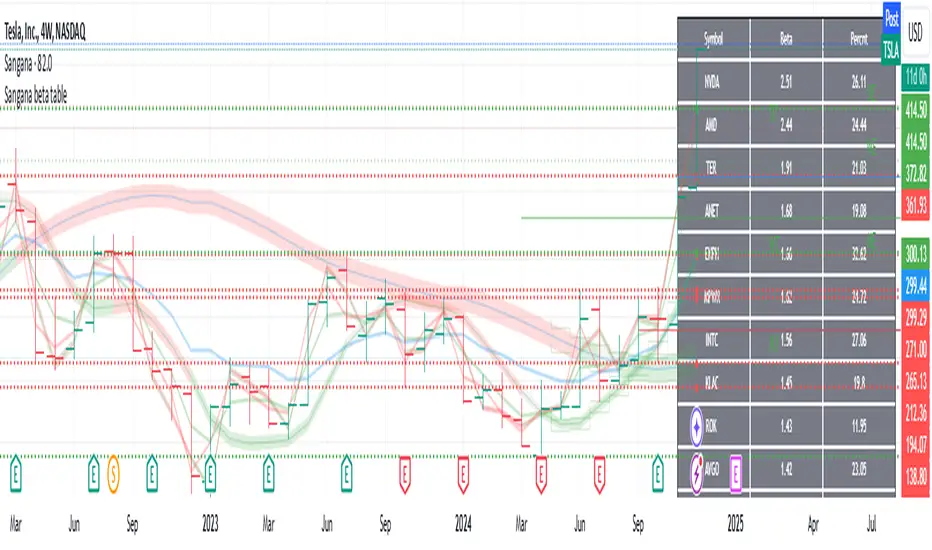
This indicator shows three values on a table.
First column is stocks list from a particular sector(sector selection from settings)
Second column is beta of stock. Beta can be used to check how correlated(multiplied by how volatile) the stock is with respect to market S&P500 or Nifty500.
Third column is average percentage of a stock price movement in a month from low price to high price. This is just calculated on the price. If one enters at the low of that monthly candle and exits at the high of that monthly candle, they can expect to gain that much percentage on an average that is shown in this column.
How to use this indicator: Bigger returns on a stock is expected if it swings good amount of percentage from low to high on a regular basis. Either short term or long term, investing in the stocks which high average percentage from low to high, yields better returns. However downside also gives bigger losses if stock is going down. Stay in high volatile stocks, if one is sure of upside movement.
Sorting of beta column or percentage column can be chosen on settings. Sorting is always down high to low.
This indicator is tracks stocks in S&P500 or Nifty500.
릴리즈 노트
Minor bug fix for beta calculation with respect to SPY.보호된 스크립트입니다
이 스크립트는 비공개 소스로 게시됩니다. 하지만 이를 자유롭게 제한 없이 사용할 수 있습니다 – 자세한 내용은 여기에서 확인하세요.
면책사항
해당 정보와 게시물은 금융, 투자, 트레이딩 또는 기타 유형의 조언이나 권장 사항으로 간주되지 않으며, 트레이딩뷰에서 제공하거나 보증하는 것이 아닙니다. 자세한 내용은 이용 약관을 참조하세요.
보호된 스크립트입니다
이 스크립트는 비공개 소스로 게시됩니다. 하지만 이를 자유롭게 제한 없이 사용할 수 있습니다 – 자세한 내용은 여기에서 확인하세요.
면책사항
해당 정보와 게시물은 금융, 투자, 트레이딩 또는 기타 유형의 조언이나 권장 사항으로 간주되지 않으며, 트레이딩뷰에서 제공하거나 보증하는 것이 아닙니다. 자세한 내용은 이용 약관을 참조하세요.