OPEN-SOURCE SCRIPT
Advanced Divergence Oscillator
Introduction to ADO
The Advanced Divergence Oscillator (ADO) is a modern tool crafted for traders in various markets like stocks, forex, or cryptocurrencies. Imagine it as a smart gadget that helps you understand the ebb and flow of market prices. Unlike standard tools, ADO provides a more nuanced view, enabling you to grasp subtle changes in market trends.
Functionality of ADO
ADO operates by observing and comparing market price movements over different timeframes. Picture a racetrack where cars are moving at various speeds. Some are racing ahead, while others are gradually picking up pace. ADO keeps track of these varying 'speeds' in market prices.
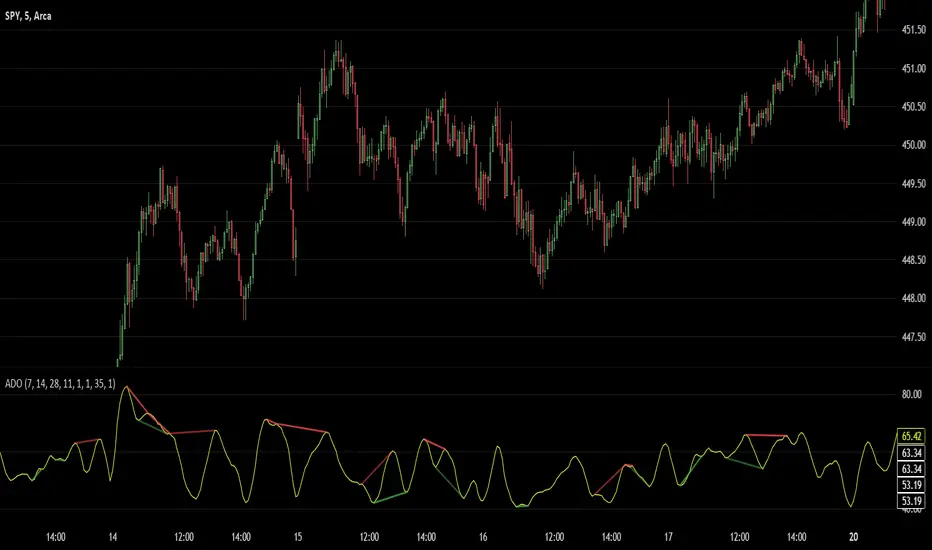
By analyzing these movements, ADO generates a smooth, flowing line – the oscillator. This line moves in a wave-like pattern, offering hints about the market's momentum and possible future trends. When the line moves up, it suggests increasing prices, and when it moves down, it hints at falling prices.
How to Use ADO
Setup: You can easily integrate ADO into your trading platform, adjusting settings like length and color to suit your preference.
Reading the Oscillator: Watch for the oscillator's movement. Rising and falling patterns can indicate potential buying or selling opportunities.
Identifying Divergences: ADO excels in spotting divergences – situations where market prices and the oscillator don't align. For instance, if prices are climbing but the oscillator is falling, it might signal a potential price drop ahead.
Brief History of the Ultimate Oscillator
The concept of oscillators in trading isn’t new. The Ultimate Oscillator, developed by Larry Williams in the 1970s, is a foundational tool in this field. Williams' innovation was to combine short, intermediate, and long-term market trends into a single oscillator. This approach offered a more comprehensive market view, helping traders make informed decisions.
The ADO is a step further in this evolution. It takes the core principles of the Ultimate Oscillator and enhances them with proper smoothing and divergence detection methods. This evolution represents the continuous effort in the trading community to refine tools for better market analysis and decision-making.
The Advanced Divergence Oscillator (ADO) is a modern tool crafted for traders in various markets like stocks, forex, or cryptocurrencies. Imagine it as a smart gadget that helps you understand the ebb and flow of market prices. Unlike standard tools, ADO provides a more nuanced view, enabling you to grasp subtle changes in market trends.
Functionality of ADO
ADO operates by observing and comparing market price movements over different timeframes. Picture a racetrack where cars are moving at various speeds. Some are racing ahead, while others are gradually picking up pace. ADO keeps track of these varying 'speeds' in market prices.
By analyzing these movements, ADO generates a smooth, flowing line – the oscillator. This line moves in a wave-like pattern, offering hints about the market's momentum and possible future trends. When the line moves up, it suggests increasing prices, and when it moves down, it hints at falling prices.
How to Use ADO
Setup: You can easily integrate ADO into your trading platform, adjusting settings like length and color to suit your preference.
Reading the Oscillator: Watch for the oscillator's movement. Rising and falling patterns can indicate potential buying or selling opportunities.
Identifying Divergences: ADO excels in spotting divergences – situations where market prices and the oscillator don't align. For instance, if prices are climbing but the oscillator is falling, it might signal a potential price drop ahead.
Brief History of the Ultimate Oscillator
The concept of oscillators in trading isn’t new. The Ultimate Oscillator, developed by Larry Williams in the 1970s, is a foundational tool in this field. Williams' innovation was to combine short, intermediate, and long-term market trends into a single oscillator. This approach offered a more comprehensive market view, helping traders make informed decisions.
The ADO is a step further in this evolution. It takes the core principles of the Ultimate Oscillator and enhances them with proper smoothing and divergence detection methods. This evolution represents the continuous effort in the trading community to refine tools for better market analysis and decision-making.
오픈 소스 스크립트
트레이딩뷰의 진정한 정신에 따라, 이 스크립트의 작성자는 이를 오픈소스로 공개하여 트레이더들이 기능을 검토하고 검증할 수 있도록 했습니다. 작성자에게 찬사를 보냅니다! 이 코드는 무료로 사용할 수 있지만, 코드를 재게시하는 경우 하우스 룰이 적용된다는 점을 기억하세요.
KP
면책사항
해당 정보와 게시물은 금융, 투자, 트레이딩 또는 기타 유형의 조언이나 권장 사항으로 간주되지 않으며, 트레이딩뷰에서 제공하거나 보증하는 것이 아닙니다. 자세한 내용은 이용 약관을 참조하세요.
오픈 소스 스크립트
트레이딩뷰의 진정한 정신에 따라, 이 스크립트의 작성자는 이를 오픈소스로 공개하여 트레이더들이 기능을 검토하고 검증할 수 있도록 했습니다. 작성자에게 찬사를 보냅니다! 이 코드는 무료로 사용할 수 있지만, 코드를 재게시하는 경우 하우스 룰이 적용된다는 점을 기억하세요.
KP
면책사항
해당 정보와 게시물은 금융, 투자, 트레이딩 또는 기타 유형의 조언이나 권장 사항으로 간주되지 않으며, 트레이딩뷰에서 제공하거나 보증하는 것이 아닙니다. 자세한 내용은 이용 약관을 참조하세요.