OPEN-SOURCE SCRIPT
ReNKoLiNe - A line on chart mimicking RENKO bricks
DESCRIPTION
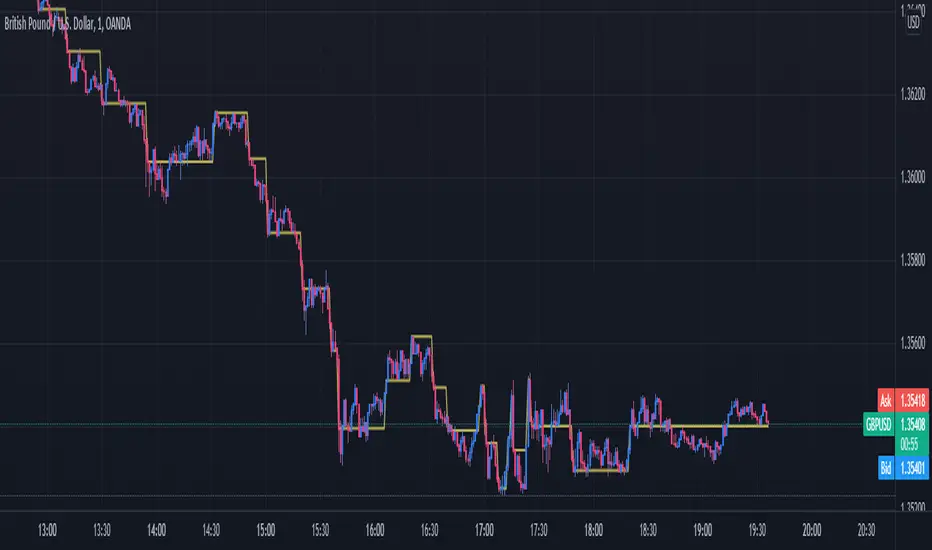
RENKOLINE Indicator - mimics RENKO charts on ANY timeframe. It is not absolutely fixed, which is actually an advantage,
because it does not close bricks before the actual close of a candle.
An advantage, if one knows how to play with the "bricksize"
Of course it has a short side of delaying entry in case the direction momentum continues.
CDL is difference between current close and the RenkoLine i.e. distance to Candle(close) to Line(renko). This could provide idea for the deviation between candle close and line value.
It is only a value. I did not find a way to draw it properly.
Someone more experienced could help :)
오픈 소스 스크립트
트레이딩뷰의 진정한 정신에 따라, 이 스크립트의 작성자는 이를 오픈소스로 공개하여 트레이더들이 기능을 검토하고 검증할 수 있도록 했습니다. 작성자에게 찬사를 보냅니다! 이 코드는 무료로 사용할 수 있지만, 코드를 재게시하는 경우 하우스 룰이 적용된다는 점을 기억하세요.
면책사항
해당 정보와 게시물은 금융, 투자, 트레이딩 또는 기타 유형의 조언이나 권장 사항으로 간주되지 않으며, 트레이딩뷰에서 제공하거나 보증하는 것이 아닙니다. 자세한 내용은 이용 약관을 참조하세요.
오픈 소스 스크립트
트레이딩뷰의 진정한 정신에 따라, 이 스크립트의 작성자는 이를 오픈소스로 공개하여 트레이더들이 기능을 검토하고 검증할 수 있도록 했습니다. 작성자에게 찬사를 보냅니다! 이 코드는 무료로 사용할 수 있지만, 코드를 재게시하는 경우 하우스 룰이 적용된다는 점을 기억하세요.
면책사항
해당 정보와 게시물은 금융, 투자, 트레이딩 또는 기타 유형의 조언이나 권장 사항으로 간주되지 않으며, 트레이딩뷰에서 제공하거나 보증하는 것이 아닙니다. 자세한 내용은 이용 약관을 참조하세요.