OPEN-SOURCE SCRIPT
Composite RSI [KFB Quant]
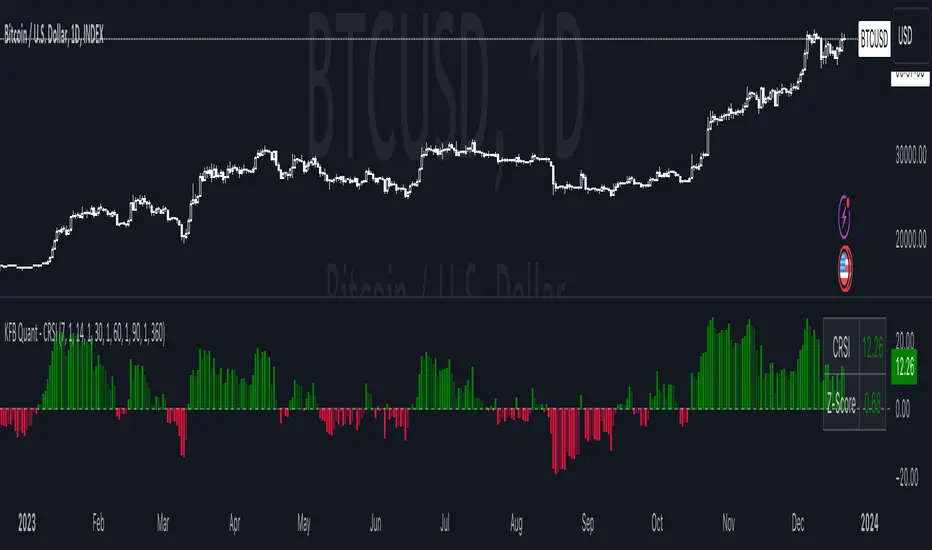
The Composite RSI (CRSI) is a momentum oscillator that combines 5 adjustable RSI's. It also has a Z-Score to make it easier to identify potential market extremes.
How to adjust the indicator
How to adjust the indicator
- Inside the Length & Impact Configuration tab you can adjust the length and impact of each RSI as well as the Z-Score length specific to your needs. The default length inputs are 7, 14, 30, 60, 90 (RSI 1 - RSI 5) and the default impact is set to 1.0 for all RSI's. Default length for Z-Score is 360.
- Inside the Style Configuration tab you can pick what you want to display(plot). The options are: CRSI, Z-Score, Overview Table and the individual RSI's.
- Inside the Color Configuration tab you can customize the color of each plot.
How the script worksCRSI = rsi_sum / imp_sumZ-Score = (crsi - crsi_mean) / crsi_stdev - rsi_sum = (rsi_1 -50) + (rsi_2 -50) + (rsi_3 -50) + (rsi_4 -50) + (rsi_5 -50)
- imp_sum = imp_1 + imp_2 + imp_3 + imp_4 + imp_5
- crsi_mean = Average of the crsi over the defined period in Z-Score Length
- crsi_stdev = StDev of crsi over the defined period in Z-Score Length
This is not financial advice. Trading is risky & most traders lose money. Past performance does not guarantee future results. This indicator is for informational & educational purposes only.
오픈 소스 스크립트
트레이딩뷰의 진정한 정신에 따라, 이 스크립트의 작성자는 이를 오픈소스로 공개하여 트레이더들이 기능을 검토하고 검증할 수 있도록 했습니다. 작성자에게 찬사를 보냅니다! 이 코드는 무료로 사용할 수 있지만, 코드를 재게시하는 경우 하우스 룰이 적용된다는 점을 기억하세요.
면책사항
해당 정보와 게시물은 금융, 투자, 트레이딩 또는 기타 유형의 조언이나 권장 사항으로 간주되지 않으며, 트레이딩뷰에서 제공하거나 보증하는 것이 아닙니다. 자세한 내용은 이용 약관을 참조하세요.
오픈 소스 스크립트
트레이딩뷰의 진정한 정신에 따라, 이 스크립트의 작성자는 이를 오픈소스로 공개하여 트레이더들이 기능을 검토하고 검증할 수 있도록 했습니다. 작성자에게 찬사를 보냅니다! 이 코드는 무료로 사용할 수 있지만, 코드를 재게시하는 경우 하우스 룰이 적용된다는 점을 기억하세요.
면책사항
해당 정보와 게시물은 금융, 투자, 트레이딩 또는 기타 유형의 조언이나 권장 사항으로 간주되지 않으며, 트레이딩뷰에서 제공하거나 보증하는 것이 아닙니다. 자세한 내용은 이용 약관을 참조하세요.