PROTECTED SOURCE SCRIPT
Key Levels All in One
A Clean OHLC Levels Toolkit (with Globex & ATH)
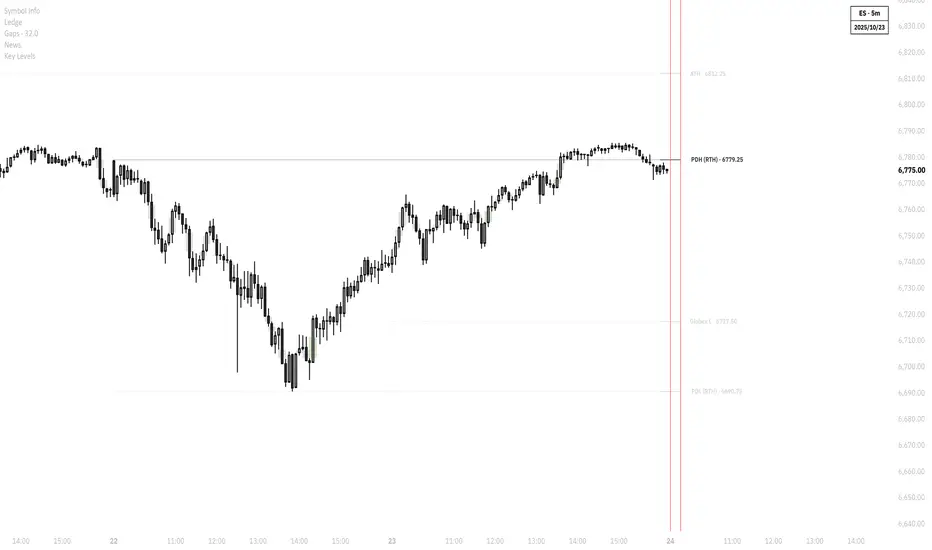
Levels is a highly configurable OHLC levels tool designed to give traders multi-timeframe context without overwhelming the chart. It plots Daily/Weekly/Monthly levels, Globex session extremes, and an All-Time High line—then keeps everything readable with label merging, optional fading, and careful session logic.
How to Use
Choose your sets: Toggle Daily, Weekly, Monthly, Globex, and ATH in Display.
Pick which levels to show: For each set, enable any combination of Open / High / Low / Close, select line style (solid/dashed/dotted), and width.
Trace the origin (optional): “Trace back” draws a subtle line from the level’s origin candle to the right edge.
Tame the clutter: Turn on Label merging and/or ATR-based fading to reduce noise near the current price.
Place the lines where you want them: Use Offset to Left/Right to control how far lines extend.
Scope & scale: Limit how many higher-timeframe sets render and Hide Above a chosen chart interval to keep lower timeframes clean.
Key Features
Daily / Weekly / Monthly HTFs: Plot previous period Open, High, Low, Close with per-level color, style, and width.
RTH-aware daily labels: On Regular Trading Hours charts, the script adds PDH (RTH) and PDL (RTH) variants alongside standard PDH/PDL for precise session context.
Globex session extremes: Automatically tracks Globex High/Low and, auto-hide a level the moment it’s touched during RTH to declutter once the market interacts with it.
All-Time High line: Plot ATH with optional trace-back to the origin bar for quick historical orientation.
Label merging (smart de-duplication): Nearby labels (e.g., PDH / PWH / PMH clustering) can be merged into a single tag showing combined names—and, if enabled, a single price or price range.
Readable labels your way: Toggle bold, numeric size, full names (e.g., “Previous Day High”) vs. tickers like PDH, show/hide price, and optionally match label color to the line color.
Fade distant levels: Reduce transparency for levels beyond a configurable ATR window around the current price to highlight what matters now.
Chart-friendly by design: Choose how many HTF sets can render at once and disable the indicator above a selected timeframe for performance and clarity.
Timeframe & Session Settings
Limit to higher timeframe sets: Cap visible HTF groups (e.g., only the next 1–3 higher sets) for a cleaner stack.
Hide Above: Automatically disable the indicator on charts above a chosen interval (e.g., anything higher than 60m).
Offsets: Offset to Left and Offset to Right control the horizontal span of each line.
Note: There is no “Offset between HTFs”—levels are aligned cleanly; spacing is managed by left/right offsets only.
HTF Controls (per set)
Pick levels: Any combination of O/H/L/C.
Style: Solid / dashed / dotted and width.
Trace back: Optional origin trace (inherit or custom style/size).
Max count: Limit how many back levels are kept per set.
Labels & Merging
Rich formatting: Bold text, numeric size, color & background control, optional price suffix, and full vs. short names.
Merge within threshold: Define a price threshold to bucket nearby labels; the tool produces a single, tidy label (e.g., PDH / PWH / PMH · 4321.25).
Custom merge styling: Separate text and background colors for merged labels.
Fading Levels (ATR-aware)
Change Transparency: Set how much to fade.
Range window: Only levels within X ATRs (X candles’ ATR) of current price retain full opacity.
ATR length: Choose the averaging window used in the calculation.
보호된 스크립트입니다
이 스크립트는 비공개 소스로 게시됩니다. 하지만 제한 없이 자유롭게 사용할 수 있습니다 — 여기에서 자세히 알아보기.
면책사항
이 정보와 게시물은 TradingView에서 제공하거나 보증하는 금융, 투자, 거래 또는 기타 유형의 조언이나 권고 사항을 의미하거나 구성하지 않습니다. 자세한 내용은 이용 약관을 참고하세요.
면책사항
이 정보와 게시물은 TradingView에서 제공하거나 보증하는 금융, 투자, 거래 또는 기타 유형의 조언이나 권고 사항을 의미하거나 구성하지 않습니다. 자세한 내용은 이용 약관을 참고하세요.