PROTECTED SOURCE SCRIPT
candle stats v1
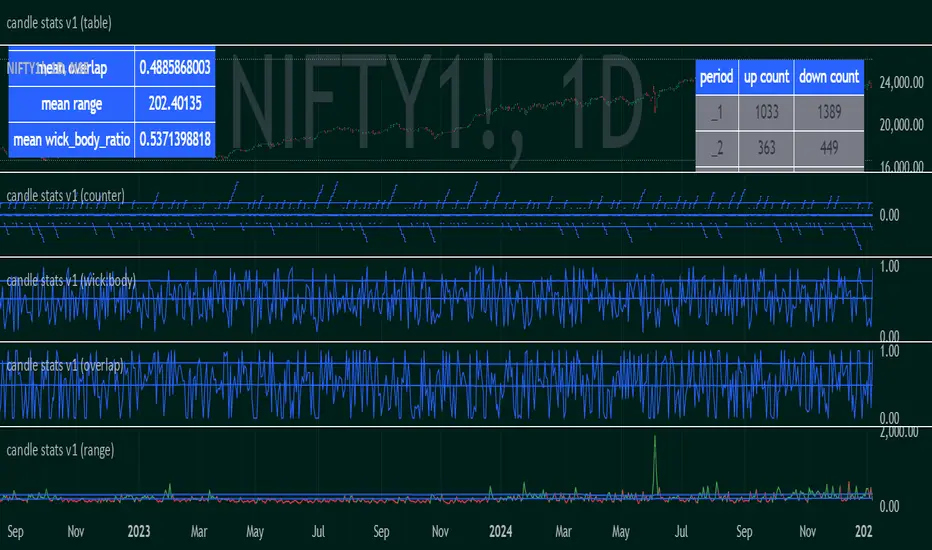
Objective:
Capture sequential/subsequent candle's relative properties
Average observations to represent the landscape of the marketplace
Parameters:
"range" : high-low
"overlap" : range - range[1]
"wick_body_ratio" : (range - abs(open-close))/range
"up_count" for "period" : number of occurrences where <period> consecutive candles have low>low[i+1]. (note: the values are not cumulative over period)
*"down_count" for "period" : number of occurrences where <period> consecutive candles have high<high[i+1]. (note: the values are not cumulative over period)
** the last counter includes the value for "period" and all above
Basic inferences:
mean_range could be used to derive at an appropriate hard-stoploss
high wick to body ratio indicates healthy buzzing market, ie, each candle has a high frequency standing wave within it. a lower value indicates that the timeframe is ordered and highly directional
low overlap indicates trend definition/resolution
the counters show how likely or unlikely a run up or run down of a particular length is
a combination of counter and mean_range could be used to derive at an appropriate take profit
Use case:
to determine the appropriate timeframe to develop or apply a strategy
Future enhancements:
more complex relationships such as higher highs and lower lows
frequency of oscillations
보호된 스크립트입니다
이 스크립트는 비공개 소스로 게시됩니다. 하지만 이를 자유롭게 제한 없이 사용할 수 있습니다 – 자세한 내용은 여기에서 확인하세요.
면책사항
해당 정보와 게시물은 금융, 투자, 트레이딩 또는 기타 유형의 조언이나 권장 사항으로 간주되지 않으며, 트레이딩뷰에서 제공하거나 보증하는 것이 아닙니다. 자세한 내용은 이용 약관을 참조하세요.
보호된 스크립트입니다
이 스크립트는 비공개 소스로 게시됩니다. 하지만 이를 자유롭게 제한 없이 사용할 수 있습니다 – 자세한 내용은 여기에서 확인하세요.
면책사항
해당 정보와 게시물은 금융, 투자, 트레이딩 또는 기타 유형의 조언이나 권장 사항으로 간주되지 않으며, 트레이딩뷰에서 제공하거나 보증하는 것이 아닙니다. 자세한 내용은 이용 약관을 참조하세요.