OPEN-SOURCE SCRIPT
업데이트됨 Composite Index [TipsChain]
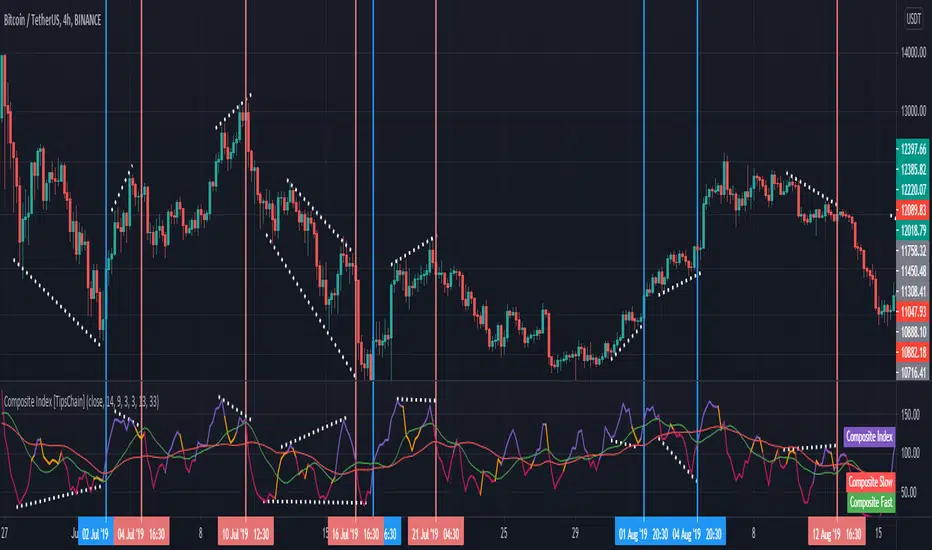
This is a formula Ms Brown developed to identify divergence failures with in the RSI . This also highlights the horizontal support levels with in the indicator area.
The Composite Index study comprises 2 momentum indicators on the RSI which are smoothed using a moving average. Control of the upper and lower indicators can be used to adjust the periods represented by each through the Object Properties dialog box for the study.
The Composite Index is an oscillator that will warn when the RSI is failing to detect a price trend reversal by forming divergences with the RSI. It can be used in any time frame or market.
Usage:
1. Check hidden and regular divergences on RSI+COMPOSITE_INDEX and PRICE+COMPOSITE_INDEX.
2. After finding divergence wait for COMPOSITE_INDEX to cross under/over it's moving averages to trigger.
릴리즈 노트
Recreate the indicator according to Ms. Brown's book "Technical analysis for the trading professional"The formula of this indicator on page 369 of this book is as follows:
Step 1: create a 9-period momentum indicator of 14-period RSI. Yes, it is momentum on RSI , not price. This is an indicator on an indicator.
Step 2: create a very short3-period RSI and then a simple 3-period moving average of the 3-period RSI to smooth is Slightly.
Step 3: add Step 1 and 2 together to create the Composite Index.
Step 4: create two simple moving averages of the Composite Index using the period 13 and 33.
Step 5: plot the composite Index and its two simple averages as three lines in a separate frame under the price data.
오픈 소스 스크립트
트레이딩뷰의 진정한 정신에 따라, 이 스크립트의 작성자는 이를 오픈소스로 공개하여 트레이더들이 기능을 검토하고 검증할 수 있도록 했습니다. 작성자에게 찬사를 보냅니다! 이 코드는 무료로 사용할 수 있지만, 코드를 재게시하는 경우 하우스 룰이 적용된다는 점을 기억하세요.
면책사항
해당 정보와 게시물은 금융, 투자, 트레이딩 또는 기타 유형의 조언이나 권장 사항으로 간주되지 않으며, 트레이딩뷰에서 제공하거나 보증하는 것이 아닙니다. 자세한 내용은 이용 약관을 참조하세요.
오픈 소스 스크립트
트레이딩뷰의 진정한 정신에 따라, 이 스크립트의 작성자는 이를 오픈소스로 공개하여 트레이더들이 기능을 검토하고 검증할 수 있도록 했습니다. 작성자에게 찬사를 보냅니다! 이 코드는 무료로 사용할 수 있지만, 코드를 재게시하는 경우 하우스 룰이 적용된다는 점을 기억하세요.
면책사항
해당 정보와 게시물은 금융, 투자, 트레이딩 또는 기타 유형의 조언이나 권장 사항으로 간주되지 않으며, 트레이딩뷰에서 제공하거나 보증하는 것이 아닙니다. 자세한 내용은 이용 약관을 참조하세요.