OPEN-SOURCE SCRIPT
업데이트됨 Daily Range

Hey traders,
at first thanks to the one and only Master Educator Stefan Kassing for sharing his legendary system with us!
And also credit to Mortdiggiddy, RootDuk and PineCoders for helping me with the script =)
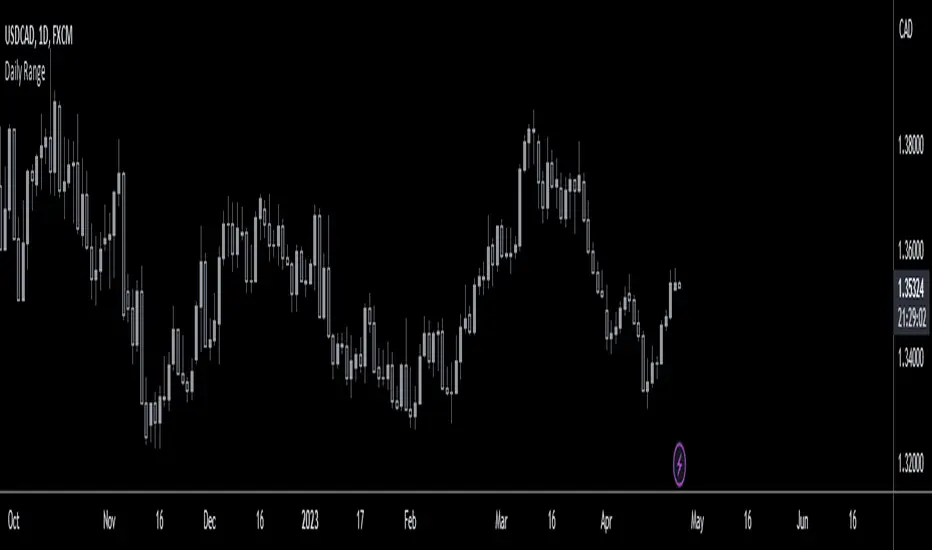
This script is calculating the daily range (in pips) of the current market you are in, in relation to the last 70 days (10 weeks).
It is used for a possible Take Profit in Stefan Kassing's System.
How to add the script to your chart:
1. Click "Add to Favorite Scripts"
-> i.imgur.com/DyGPaBz.png
2. Go in the Chart & click the little arrow in the upper bar and then click "Daily Range", then the Daily Range appears in the top left corner
-> i.imgur.com/fFl3W28.png
To avoid errors make sure to right-click the Y-Axis on the right side of the chart and then left-click "Scale Price Chart Only".
-> i.imgur.com/2UVA86u.png
Also be aware that the daily range is only showing up, if you are in the daily time interval or below and you are not hovering with the cursor over the past candles respectively above or below them.
If you are using this script in exotic currencypairs or uncommon other markets, the daily range can be incorrect or not showing up.
So don't hesitate contacting me, then I will try to add the markets that you want to.
To change the color or the decimal places of the number, you can click the gear in the upper left corner.
-> i.imgur.com/FA6Su7h.png
Happy Pips
릴리즈 노트
The calculation is done in relation to the last 50 days, not 70 days릴리즈 노트
Fixed the calculation with crypto currencies릴리즈 노트
- Changed the script to PineScript version 5- Changed the calculation of the Daily Range
- Added an input field that allows the user to modify the number of days used in the calculation of the Daily Range (the default is 50)
If there are any issues with this version, and you have improvement suggestions, please let me know.
오픈 소스 스크립트
트레이딩뷰의 진정한 정신에 따라, 이 스크립트의 작성자는 이를 오픈소스로 공개하여 트레이더들이 기능을 검토하고 검증할 수 있도록 했습니다. 작성자에게 찬사를 보냅니다! 이 코드는 무료로 사용할 수 있지만, 코드를 재게시하는 경우 하우스 룰이 적용된다는 점을 기억하세요.
면책사항
해당 정보와 게시물은 금융, 투자, 트레이딩 또는 기타 유형의 조언이나 권장 사항으로 간주되지 않으며, 트레이딩뷰에서 제공하거나 보증하는 것이 아닙니다. 자세한 내용은 이용 약관을 참조하세요.
오픈 소스 스크립트
트레이딩뷰의 진정한 정신에 따라, 이 스크립트의 작성자는 이를 오픈소스로 공개하여 트레이더들이 기능을 검토하고 검증할 수 있도록 했습니다. 작성자에게 찬사를 보냅니다! 이 코드는 무료로 사용할 수 있지만, 코드를 재게시하는 경우 하우스 룰이 적용된다는 점을 기억하세요.
면책사항
해당 정보와 게시물은 금융, 투자, 트레이딩 또는 기타 유형의 조언이나 권장 사항으로 간주되지 않으며, 트레이딩뷰에서 제공하거나 보증하는 것이 아닙니다. 자세한 내용은 이용 약관을 참조하세요.