OPEN-SOURCE SCRIPT
HL range by durga
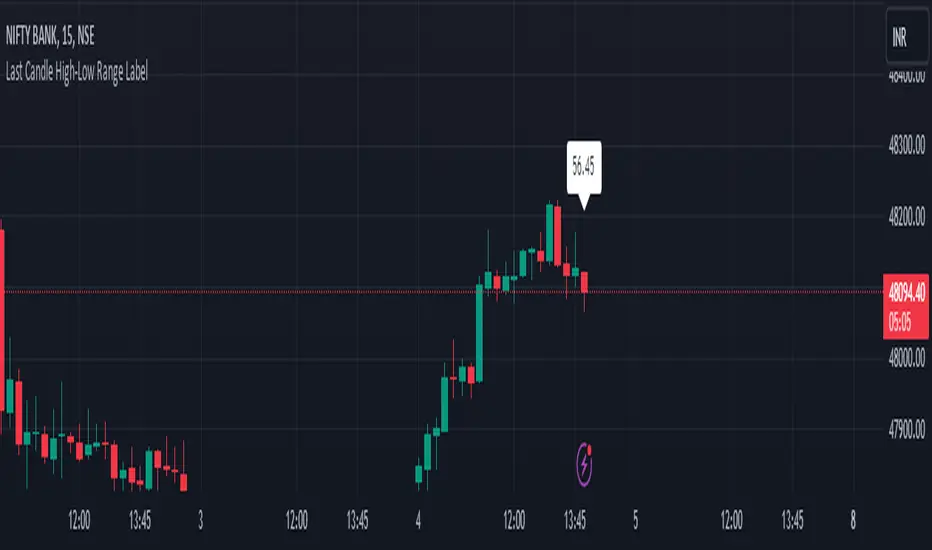
The script we've been working on is an indicator designed to display the high-low range of the last candlestick on a TradingView chart. It does so by plotting two lines: one for the high and another for the low of the last completed candlestick.
Additionally, the script includes a label that shows the numerical value of the high-low range. This label is positioned between the plotted lines, showing the difference between the high and low prices of the last candlestick.
The script operates in real-time, updating dynamically as new candlesticks form. Furthermore, it automatically removes the label after the close of the candlestick, maintaining a clean and clutter-free chart.
This indicator can help traders quickly visualize and assess the range of the last completed candlestick, aiding in their analysis of price action.
오픈 소스 스크립트
트레이딩뷰의 진정한 정신에 따라, 이 스크립트의 작성자는 이를 오픈소스로 공개하여 트레이더들이 기능을 검토하고 검증할 수 있도록 했습니다. 작성자에게 찬사를 보냅니다! 이 코드는 무료로 사용할 수 있지만, 코드를 재게시하는 경우 하우스 룰이 적용된다는 점을 기억하세요.
면책사항
해당 정보와 게시물은 금융, 투자, 트레이딩 또는 기타 유형의 조언이나 권장 사항으로 간주되지 않으며, 트레이딩뷰에서 제공하거나 보증하는 것이 아닙니다. 자세한 내용은 이용 약관을 참조하세요.
오픈 소스 스크립트
트레이딩뷰의 진정한 정신에 따라, 이 스크립트의 작성자는 이를 오픈소스로 공개하여 트레이더들이 기능을 검토하고 검증할 수 있도록 했습니다. 작성자에게 찬사를 보냅니다! 이 코드는 무료로 사용할 수 있지만, 코드를 재게시하는 경우 하우스 룰이 적용된다는 점을 기억하세요.
면책사항
해당 정보와 게시물은 금융, 투자, 트레이딩 또는 기타 유형의 조언이나 권장 사항으로 간주되지 않으며, 트레이딩뷰에서 제공하거나 보증하는 것이 아닙니다. 자세한 내용은 이용 약관을 참조하세요.