OPEN-SOURCE SCRIPT
Z-Score For Loop | MisinkoMaster
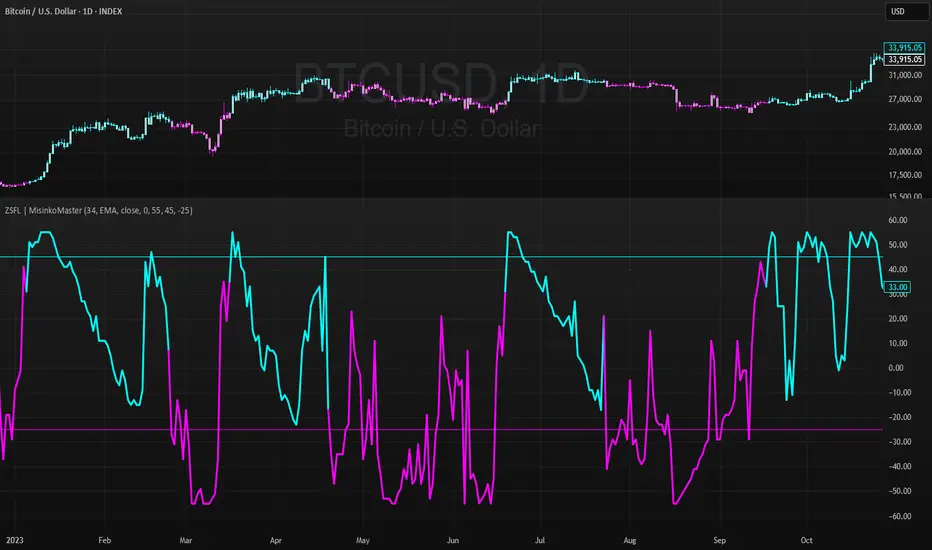
The Z-Score For Loop (ZSFL) is a unique trend-following oscillator designed to detect potential reversals and momentum shifts earlier than traditional tools, providing traders with fast, adaptive, and reliable signals.
Unlike common smoothing techniques (moving averages, medians, or modes), the ZSFL introduces a for-loop comparison method that balances speed and noise reduction, resulting in a powerful reversal-detection system.
🔎 Methodology
The indicator is built in two main stages:
Z-Score Calculation
Formula:
Z=(Source−Mean)/Standard Deviation
Z=
Standard Deviation
(Source−Mean)
The user can select the averaging method for the mean: SMA, EMA, WMA, HMA, DEMA, or TEMA.
Recommended: EMA, SMA, or WMA for balanced accuracy.
The choice of biased (sample) or unbiased (population) standard deviation is also available.
➝ On its own, the raw Z-score is fast but noisy, requiring additional filtering.
For Loop Logic (Noise Reduction)
Instead of using traditional smoothing (which adds lag), the indicator applies a for loop comparison.
The current Z-score is compared against previous values over a user-defined range (start → end).
Each comparison adds or subtracts “points”:
+1 point if the current Z-score is higher than a past Z-score.
-1 point if it is lower.
The final value is the cumulative score, reflecting whether the Z-score is generally stronger or weaker than its historical context.
➝ This approach keeps speed intact while removing much of the false noise that raw Z-scores generate.
📈 Trend Logic
Bullish Signal (Cyan) → Triggered when the score crosses above the upper threshold (default +45).
Bearish Signal (Magenta) → Triggered when the score crosses below the lower threshold (default -25).
Neutral → When the score remains between the thresholds.
Thresholds are adjustable, making the tool flexible for different assets and timeframes.
🎨 Visualization
The ZSFL score is plotted as a main oscillator line.
Upper and lower thresholds are plotted as static reference levels.
The price chart can also be color-coded with trend signals (cyan for bullish, magenta for bearish) to provide immediate visual confirmation.
⚡ Features
Adjustable Z-score length (len).
Multiple average types for the mean (SMA, EMA, WMA, HMA, DEMA, TEMA).
Toggle between biased vs. unbiased SD calculations.
Adjustable For Loop range (start, end).
Adjustable upper and lower thresholds for signal generation.
Works as both an oscillator and a price overlay tool.
✅ Use Cases
Reversal Detection → Spot early shifts before price confirms them.
Trend Confirmation → Use thresholds to filter false reversals.
System Filter → Combine with trend indicators to refine entries.
Multi-Timeframe Setup → Works well across different timeframes for swing, day, or intraday trading.
⚠️ Limitations
As with all oscillators, the ZSFL will generate false signals in sideways/choppy markets.
Optimal parameters (length, loop size, thresholds) may differ across assets.
It is not a standalone trading system — use alongside other forms of analysis (trend filters, volume, higher timeframe confluence).
오픈 소스 스크립트
트레이딩뷰의 진정한 정신에 따라, 이 스크립트의 작성자는 이를 오픈소스로 공개하여 트레이더들이 기능을 검토하고 검증할 수 있도록 했습니다. 작성자에게 찬사를 보냅니다! 이 코드는 무료로 사용할 수 있지만, 코드를 재게시하는 경우 하우스 룰이 적용된다는 점을 기억하세요.
"Better to take a step back, than to stand stuck forever."
면책사항
해당 정보와 게시물은 금융, 투자, 트레이딩 또는 기타 유형의 조언이나 권장 사항으로 간주되지 않으며, 트레이딩뷰에서 제공하거나 보증하는 것이 아닙니다. 자세한 내용은 이용 약관을 참조하세요.