OPEN-SOURCE SCRIPT
업데이트됨 Parabolic sar with breaks
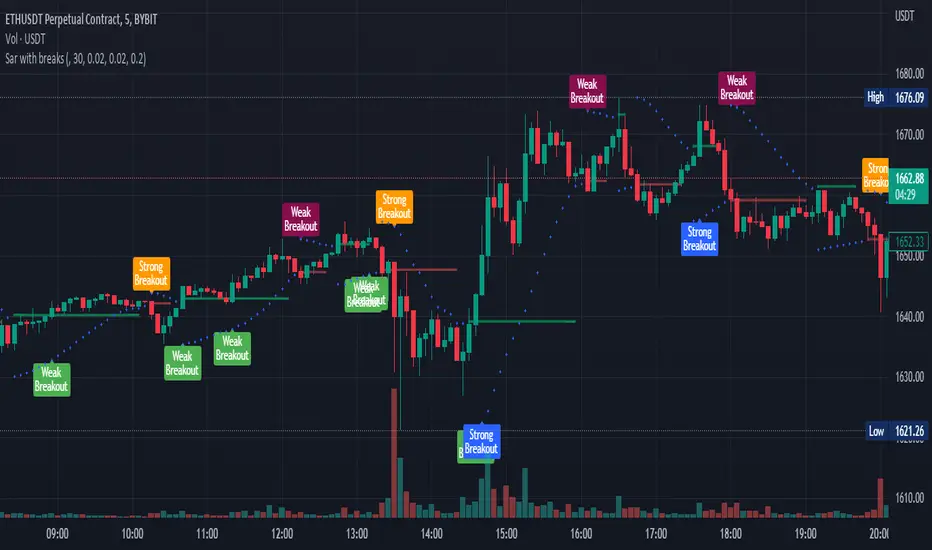
This plots a Parabolic sar and a break line on the previous sar point before the parabolic sar flips.
This is looking to be a very popular entry signal for lots of strats.
How to use:
In conjunction with other confirmation indicators;
Long: Enter long when the Parabolic sar is below the price and the price breaks above (and closes) the break line.
Short: Enter short when the Parabolic sar is above the price and the price breaks below (and closes) the break line.
A great indicator combination for this is to use a 200 ema for price trend and volume flow.
릴리즈 노트
Added long and short labels that show when the psar line is broken with high volume릴리즈 노트
Changed chartAdded check that labels should not show if the breaking candle has a long wick
릴리즈 노트
removed wick check as it was buggy릴리즈 노트
Only show signals when parabolic sar is bullish/bearish.릴리즈 노트
Selectable timeframe릴리즈 노트
Added alerts and changed breakout labels.After some research, I have found that when a parabolic Sar Breakout line is broken by price with high volume, it is much more likely to continue in that direction, and so I have have added strong and weak breakout labels.
You are able to show/hide them individually.
오픈 소스 스크립트
트레이딩뷰의 진정한 정신에 따라, 이 스크립트의 작성자는 이를 오픈소스로 공개하여 트레이더들이 기능을 검토하고 검증할 수 있도록 했습니다. 작성자에게 찬사를 보냅니다! 이 코드는 무료로 사용할 수 있지만, 코드를 재게시하는 경우 하우스 룰이 적용된다는 점을 기억하세요.
면책사항
해당 정보와 게시물은 금융, 투자, 트레이딩 또는 기타 유형의 조언이나 권장 사항으로 간주되지 않으며, 트레이딩뷰에서 제공하거나 보증하는 것이 아닙니다. 자세한 내용은 이용 약관을 참조하세요.
오픈 소스 스크립트
트레이딩뷰의 진정한 정신에 따라, 이 스크립트의 작성자는 이를 오픈소스로 공개하여 트레이더들이 기능을 검토하고 검증할 수 있도록 했습니다. 작성자에게 찬사를 보냅니다! 이 코드는 무료로 사용할 수 있지만, 코드를 재게시하는 경우 하우스 룰이 적용된다는 점을 기억하세요.
면책사항
해당 정보와 게시물은 금융, 투자, 트레이딩 또는 기타 유형의 조언이나 권장 사항으로 간주되지 않으며, 트레이딩뷰에서 제공하거나 보증하는 것이 아닙니다. 자세한 내용은 이용 약관을 참조하세요.