OPEN-SOURCE SCRIPT
업데이트됨 10 Minute Futures Session Open Range
Inspired by SamRecio's 30sec OR script.
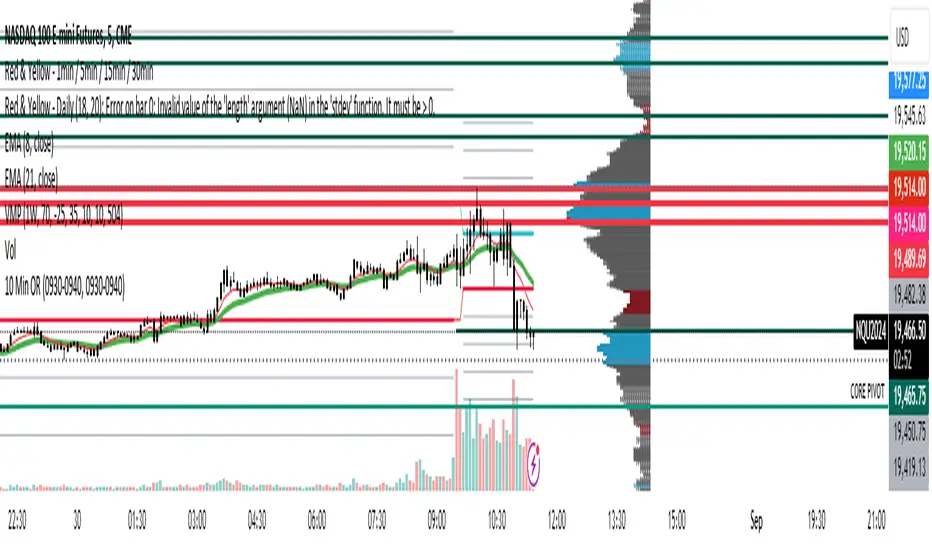
The 10 minute Opening Range (OR) dynamically identifies and visualizes the opening range of a trading session within the first 10 minutes after the market opens at 9:30 AM EST, concluding at 4:00 PM EST, reflecting the typical trading hours for U.S. stock exchanges. This indicator is particularly useful for strategies that rely on the initial market momentum and direction established during the early moments of the trading session.
Upon activation, the indicator calculates the highest (orHigh) and lowest (orLow) price levels reached during the first 10 minutes of the trading session, marking these levels with green (for the high) and red (for the low) lines directly on the chart overlay. Additionally, it computes and plots a midpoint (midPoint) between these high and low levels, displayed as a blue line, offering a visual reference for the median of the opening range.
The calculations are reset daily to ensure the indicator accurately reflects the opening range for each new trading session. By doing so, it avoids carrying over data from previous days, maintaining relevance and precision for day traders and those utilizing short-term trading strategies. The indicator also incorporates timezone adjustments to align with the America/New_York timezone, ensuring that the opening range is accurately captured regardless of the user's local timezone.
This tool is invaluable for traders looking to capitalize on breakout or reversion strategies around the opening range, providing clear visual cues for significant price levels established at the start of the trading session. By focusing on the first 10 minutes of trading, it caters to a specific segment of the market that believes the initial movements can set the tone for the rest of the day's trading activity.
릴리즈 노트
Updated Previous Version to include extension targets (credit to MichiganDolf)The 10 minute Opening Range (OR) dynamically identifies and visualizes the opening range of a trading session within the first 10 minutes after the market opens at 9:30 AM EST, concluding at 4:00 PM EST, reflecting the typical trading hours for U.S. stock exchanges. This indicator is particularly useful for strategies that rely on the initial market momentum and direction established during the early moments of the trading session.
Upon activation, the indicator calculates the highest (orHigh) and lowest (orLow) price levels reached during the first 10 minutes of the trading session, marking these levels with green (for the high) and red (for the low) lines directly on the chart overlay. Additionally, it computes and plots a midpoint (midPoint) between these high and low levels, displayed as a blue line, offering a visual reference for the median of the opening range.
The calculations are reset daily to ensure the indicator accurately reflects the opening range for each new trading session. By doing so, it avoids carrying over data from previous days, maintaining relevance and precision for day traders and those utilizing short-term trading strategies. The indicator also incorporates timezone adjustments to align with the America/New_York timezone, ensuring that the opening range is accurately captured regardless of the user's local timezone.
This tool is invaluable for traders looking to capitalize on breakout or reversion strategies around the opening range, providing clear visual cues for significant price levels established at the start of the trading session. By focusing on the first 10 minutes of trading, it caters to a specific segment of the market that believes the initial movements can set the tone for the rest of the day's trading activity.
릴리즈 노트
Fixed timeframe selection changing the opening range. Static now across all timeframes오픈 소스 스크립트
트레이딩뷰의 진정한 정신에 따라, 이 스크립트의 작성자는 이를 오픈소스로 공개하여 트레이더들이 기능을 검토하고 검증할 수 있도록 했습니다. 작성자에게 찬사를 보냅니다! 이 코드는 무료로 사용할 수 있지만, 코드를 재게시하는 경우 하우스 룰이 적용된다는 점을 기억하세요.
면책사항
해당 정보와 게시물은 금융, 투자, 트레이딩 또는 기타 유형의 조언이나 권장 사항으로 간주되지 않으며, 트레이딩뷰에서 제공하거나 보증하는 것이 아닙니다. 자세한 내용은 이용 약관을 참조하세요.
오픈 소스 스크립트
트레이딩뷰의 진정한 정신에 따라, 이 스크립트의 작성자는 이를 오픈소스로 공개하여 트레이더들이 기능을 검토하고 검증할 수 있도록 했습니다. 작성자에게 찬사를 보냅니다! 이 코드는 무료로 사용할 수 있지만, 코드를 재게시하는 경우 하우스 룰이 적용된다는 점을 기억하세요.
면책사항
해당 정보와 게시물은 금융, 투자, 트레이딩 또는 기타 유형의 조언이나 권장 사항으로 간주되지 않으며, 트레이딩뷰에서 제공하거나 보증하는 것이 아닙니다. 자세한 내용은 이용 약관을 참조하세요.