INVITE-ONLY SCRIPT
Hershey's CoCo part 2
This is my variation of the Correlation Coefficient and I call it "Hershey's CoCo". The indicator identifies very specific Stock, Sector and Market pressures on whatever symbol you are evaluating.
If interested, follow me and send me requests to evaluate your stock or sector as I refine this tool.
***********************************************
Now we'll look at some chart examples...
The first long red arrow tells us both the stock and sector are dropping and the sector is down more than the stock. So the next three are red as well and are DECREASING in size, approaching the end of that sector pressure and a reversal in price. You'll see this often where arrow length predicts reversals.
Sample1
This stock is rising with a long series of mostly green, then gets hit with some large BLACK arrows, which is purely stock pressure.. so much pressure even the couple green arrows could not stop the slide.
Sample2
Look at the momentum of those huge blue bars... decreasing blue arrow lengths at the end of the rally and then confirmed with some profit taking black bars at the end.
Sample3
Consecutive and larger blue bars clearly tell this story.
Sample4
Black and red dominate.
Sample5
I brought up this stock after someone told me they caught some of the ride. This sample has a Stock/Sector CoCo on the left and a Sector/Market CoCo on the right. CoCo should really shine following large gaps.
Sample6
***********************************************
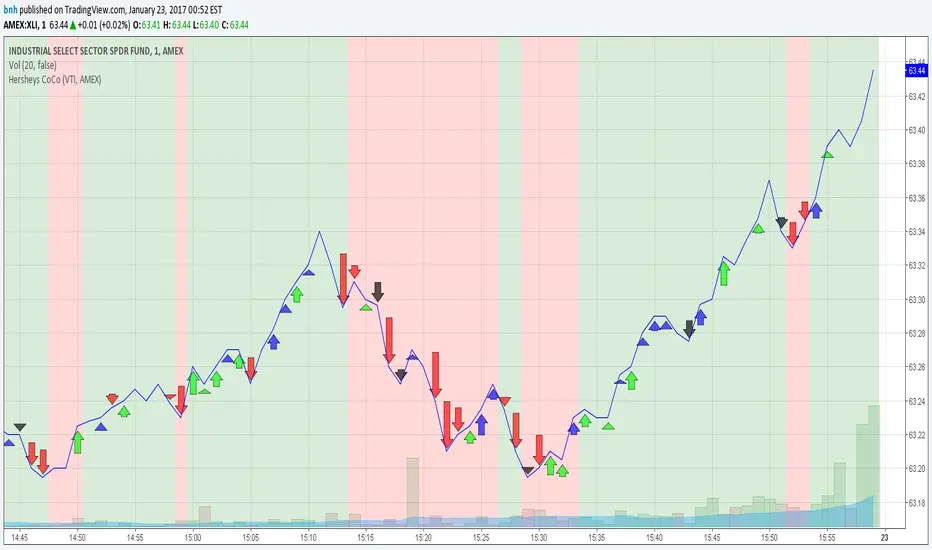
Here are two charts that show how to identify sectors that are gaining independent price movement... both are showing sector charts from the previous week.
This is comparing the Industrial Sector to Market. The background colors are an average of all arrow differences, so it is clearly showing sector momentum as the week progresses.
Sample7
Showing the Healthcare sector and confirming independent and growing weakness compared to the market.
Sample8
***********************************************
Using Hershey's CoCo...
- During trading hours, with 1 minute ticks, you'll clearly know which container drove the larger price movements, be it the Stock, the Sector or the Market.
- This is an important point about the information this tool gives you. If you see a stock price pattern emerging in front of you that can be attributed to the Sector or Market and NOT the Stock itself, confidence in that pattern should drop. I recently saw the completion of the right side of a cup formation that clearly came from the sector. Knowing if a price formation is driven by the large institutional buyers that have your stock on THEIR screens is very useful!
Good trading, and feel free to message with any questions or comments,
Brian Hershey
Here are the S&P SPDR Sector Fund symbols if you wish to import them into a new TradingView Watchlist...
AMEX:XLB,AMEX:XLE,AMEX:XLF,AMEX:XLI,AMEX:XLK,AMEX:XLP,AMEX:XLRE,AMEX:XLU,AMEX:XLV,AMEX:XLY,AMEX:XTN
If interested, follow me and send me requests to evaluate your stock or sector as I refine this tool.
***********************************************
Now we'll look at some chart examples...
The first long red arrow tells us both the stock and sector are dropping and the sector is down more than the stock. So the next three are red as well and are DECREASING in size, approaching the end of that sector pressure and a reversal in price. You'll see this often where arrow length predicts reversals.
Sample1
This stock is rising with a long series of mostly green, then gets hit with some large BLACK arrows, which is purely stock pressure.. so much pressure even the couple green arrows could not stop the slide.
Sample2
Look at the momentum of those huge blue bars... decreasing blue arrow lengths at the end of the rally and then confirmed with some profit taking black bars at the end.
Sample3
Consecutive and larger blue bars clearly tell this story.
Sample4
Black and red dominate.
Sample5
I brought up this stock after someone told me they caught some of the ride. This sample has a Stock/Sector CoCo on the left and a Sector/Market CoCo on the right. CoCo should really shine following large gaps.
Sample6
***********************************************
Here are two charts that show how to identify sectors that are gaining independent price movement... both are showing sector charts from the previous week.
This is comparing the Industrial Sector to Market. The background colors are an average of all arrow differences, so it is clearly showing sector momentum as the week progresses.
Sample7
Showing the Healthcare sector and confirming independent and growing weakness compared to the market.
Sample8
***********************************************
Using Hershey's CoCo...
- During trading hours, with 1 minute ticks, you'll clearly know which container drove the larger price movements, be it the Stock, the Sector or the Market.
- This is an important point about the information this tool gives you. If you see a stock price pattern emerging in front of you that can be attributed to the Sector or Market and NOT the Stock itself, confidence in that pattern should drop. I recently saw the completion of the right side of a cup formation that clearly came from the sector. Knowing if a price formation is driven by the large institutional buyers that have your stock on THEIR screens is very useful!
Good trading, and feel free to message with any questions or comments,
Brian Hershey
Here are the S&P SPDR Sector Fund symbols if you wish to import them into a new TradingView Watchlist...
AMEX:XLB,AMEX:XLE,AMEX:XLF,AMEX:XLI,AMEX:XLK,AMEX:XLP,AMEX:XLRE,AMEX:XLU,AMEX:XLV,AMEX:XLY,AMEX:XTN
초대 전용 스크립트
이 스크립트는 작성자가 승인한 사용자만 접근할 수 있습니다. 사용하려면 요청 후 승인을 받아야 하며, 일반적으로 결제 후에 허가가 부여됩니다. 자세한 내용은 아래 작성자의 안내를 따르거나 bnh에게 직접 문의하세요.
트레이딩뷰는 스크립트의 작동 방식을 충분히 이해하고 작성자를 완전히 신뢰하지 않는 이상, 해당 스크립트에 비용을 지불하거나 사용하는 것을 권장하지 않습니다. 커뮤니티 스크립트에서 무료 오픈소스 대안을 찾아보실 수도 있습니다.
작성자 지시 사항
면책사항
해당 정보와 게시물은 금융, 투자, 트레이딩 또는 기타 유형의 조언이나 권장 사항으로 간주되지 않으며, 트레이딩뷰에서 제공하거나 보증하는 것이 아닙니다. 자세한 내용은 이용 약관을 참조하세요.