OPEN-SOURCE SCRIPT
Price Relative / Relative Strength Comparative [NeoButane]
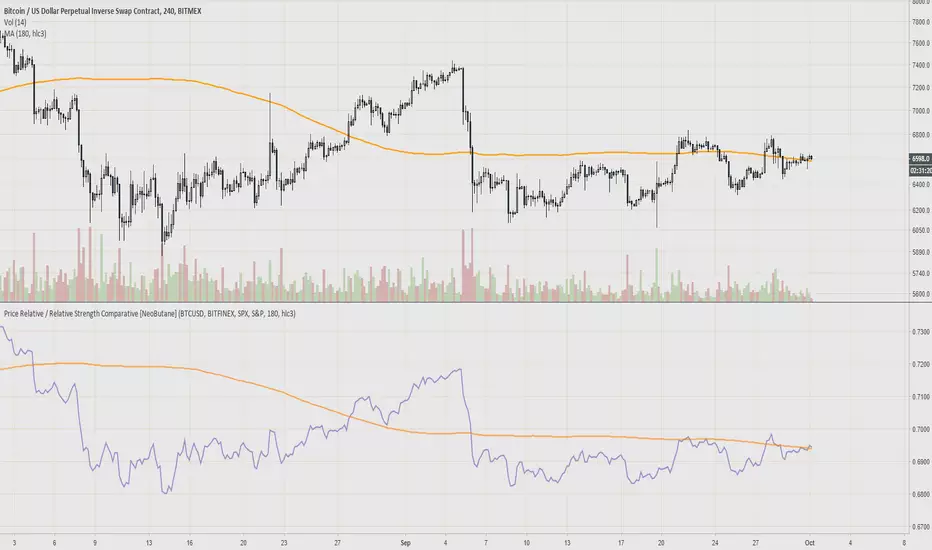
"The Price Relative indicator compares the performance of one security to another with a ratio chart."
Divergences and chart patterns can apply to this ratio.
This was created because I wanted to compare bitcoin to currency/stock indices. So far I've seen mostly confluence with cryptos. Comparing stocks against market indices better shows where the index begins to outperform the stock before price action can reveal dips in price. Using same length moving averages or divergences can help spot that.
There's a glitch where candle colors turn blue when editing. Turn the candles on and off to fix it.
Reference: stockcharts.com/school/doku.php?id=chart_school:technical_indicators:price_relative
Formula:
Price Relative = Base Security / Comparative Security
Ratio Symbol Close = Close of First Symbol / Close of Second Symbol
Ratio Symbol Open = Open of First Symbol / Close of Second Symbol
Ratio Symbol High = High of First Symbol / Close of Second Symbol
Ratio Symbol Low = Low of First Symbol / Close of Second Symbol
Note: Although StockCharts states
"Base Security / Comparative Security"
I've used
"Base Security / (Base Security + Comparative Security)
to create a ratio as the article has stated it should be.
Possible use: margin/CVD
오픈 소스 스크립트
트레이딩뷰의 진정한 정신에 따라, 이 스크립트의 작성자는 이를 오픈소스로 공개하여 트레이더들이 기능을 검토하고 검증할 수 있도록 했습니다. 작성자에게 찬사를 보냅니다! 이 코드는 무료로 사용할 수 있지만, 코드를 재게시하는 경우 하우스 룰이 적용된다는 점을 기억하세요.
My published indicators: tradingview.com/u/NeoButane/
Sorry if I haven't replied to your message yet, I'm a bit backlogged :)
Sorry if I haven't replied to your message yet, I'm a bit backlogged :)
면책사항
해당 정보와 게시물은 금융, 투자, 트레이딩 또는 기타 유형의 조언이나 권장 사항으로 간주되지 않으며, 트레이딩뷰에서 제공하거나 보증하는 것이 아닙니다. 자세한 내용은 이용 약관을 참조하세요.