OPEN-SOURCE SCRIPT
LNL Simple Hedging Tool
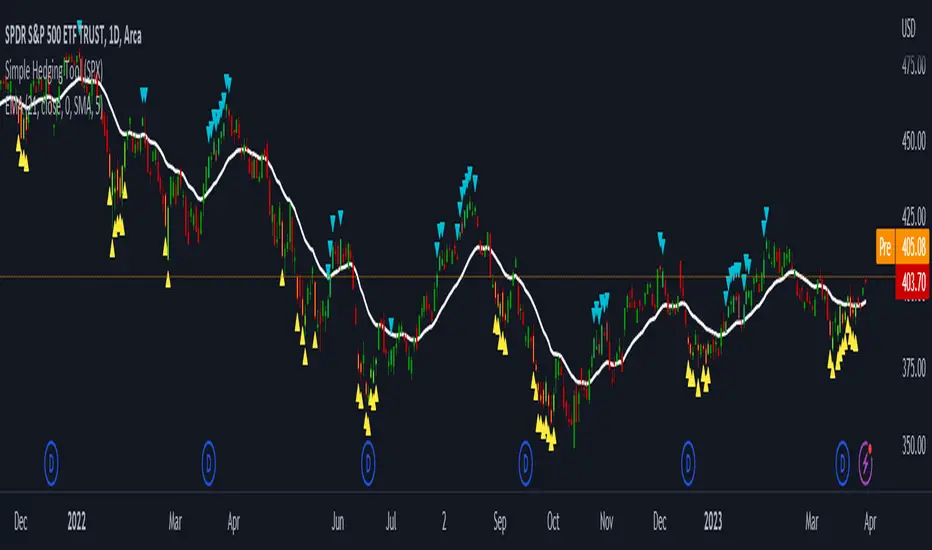
LNL Simple Hedging Tool
Simple Hedging Tool was created specifically for swing traders who struggle with hedging. This tool helps to spot the ideal moments to put the hedges on (protection of the portfolio during "high risk" times). Simple Hedging Tool will not help you when day trading. It was designed for the daily charts. It is called simple because it is pretty much self-explanatory indicator. The candles are either blue or yellow. Meaning of the colors depend on the version you are using. This tool consist of two versions:
SPX Version:
This version was designed for indexes & overall market benchmarks. In contrast with the VIX version, the SPX version is little more sophisticated since it is based on key market internals. Blue arrows above the candles? More often than not this is signalizing that the key market internals are now approaching bearish signals which means it is the best time to hedge any bullish positions. On the contrary, the yellow arrows are the good reason to lighten up of the shorts & ease off the gas pedal on any bearish outlooks.
VIX Version:
Apart from the black swan events (big market crashes) Vix usually oscillates between the daily extremes. The VIX version is based on a simple bollinger band technique which is visualized with blue & yellow arrows. Whenever the yellow arrows & candles appear, it is good time to put the hedges on & perhaps lighten up on longs.
IMPORTANT DISCLAIMER:
The signals from this tool WILL NOT TELL YOU where to buy or sell! But rather when is a good time TO NOT buy or TO NOT sell. Once the signals appear it does not necessarily mean that the move is over & reversion willl happen immidiately. These signals can be flashing for days even weeks. They are not flashing for you to change the bias but rather tighten up your exposure in case your portfolio is mostly one sided.
Hope it helps.
오픈 소스 스크립트
트레이딩뷰의 진정한 정신에 따라, 이 스크립트의 작성자는 이를 오픈소스로 공개하여 트레이더들이 기능을 검토하고 검증할 수 있도록 했습니다. 작성자에게 찬사를 보냅니다! 이 코드는 무료로 사용할 수 있지만, 코드를 재게시하는 경우 하우스 룰이 적용된다는 점을 기억하세요.
면책사항
해당 정보와 게시물은 금융, 투자, 트레이딩 또는 기타 유형의 조언이나 권장 사항으로 간주되지 않으며, 트레이딩뷰에서 제공하거나 보증하는 것이 아닙니다. 자세한 내용은 이용 약관을 참조하세요.
오픈 소스 스크립트
트레이딩뷰의 진정한 정신에 따라, 이 스크립트의 작성자는 이를 오픈소스로 공개하여 트레이더들이 기능을 검토하고 검증할 수 있도록 했습니다. 작성자에게 찬사를 보냅니다! 이 코드는 무료로 사용할 수 있지만, 코드를 재게시하는 경우 하우스 룰이 적용된다는 점을 기억하세요.
면책사항
해당 정보와 게시물은 금융, 투자, 트레이딩 또는 기타 유형의 조언이나 권장 사항으로 간주되지 않으며, 트레이딩뷰에서 제공하거나 보증하는 것이 아닙니다. 자세한 내용은 이용 약관을 참조하세요.