INVITE-ONLY SCRIPT
EDGAR Weekly Overview (EWO)
EDGAR Weekly Overview (EWO)
The EDGAR Weekly Overview (EWO) gives traders a clear map of market direction throughout the week.
It detects how price reacts to institutional zones and shows where the market could move next — whether it’s pushing upward toward R3 or falling toward S3.
From Monday’s opening, you can instantly see if the market starts building bullish momentum or showing weakness.
It helps you visualize how the weekly trend develops, so you can plan sniper entries on lower timeframes like M1 or M5 with higher accuracy.
⚙️ Key Features:
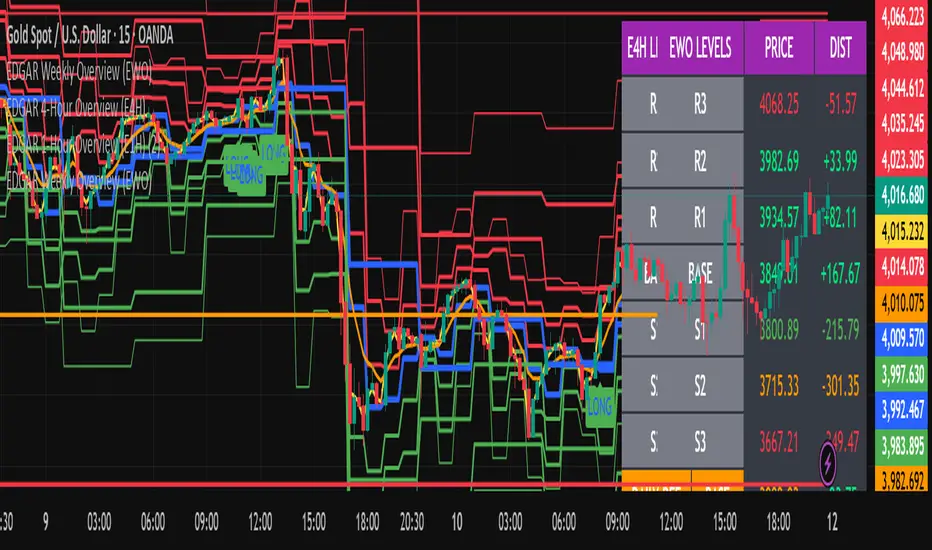
Tracks weekly high, low, and close for precise base levels
Displays resistance/support zones (R3–R1, BASE, S1–S3)
Real-time distance display for each level on dashboard
Works perfectly with gold (XAUUSD), indices, and crypto
Great for top-down analysis with 1-hour or 1-minute scalping
📈 How It Helps You:
Within a single week, you can clearly see:
Where the market is heading (up or down)
Which levels the price is likely to reject or break
How big players and institutions are positioning
This makes it easier to follow weekly structure and avoid entering against the main market flow.
The EDGAR Weekly Overview (EWO) gives traders a clear map of market direction throughout the week.
It detects how price reacts to institutional zones and shows where the market could move next — whether it’s pushing upward toward R3 or falling toward S3.
From Monday’s opening, you can instantly see if the market starts building bullish momentum or showing weakness.
It helps you visualize how the weekly trend develops, so you can plan sniper entries on lower timeframes like M1 or M5 with higher accuracy.
⚙️ Key Features:
Tracks weekly high, low, and close for precise base levels
Displays resistance/support zones (R3–R1, BASE, S1–S3)
Real-time distance display for each level on dashboard
Works perfectly with gold (XAUUSD), indices, and crypto
Great for top-down analysis with 1-hour or 1-minute scalping
📈 How It Helps You:
Within a single week, you can clearly see:
Where the market is heading (up or down)
Which levels the price is likely to reject or break
How big players and institutions are positioning
This makes it easier to follow weekly structure and avoid entering against the main market flow.
초대 전용 스크립트
이 스크립트는 작성자가 승인한 사용자만 접근할 수 있습니다. 사용하려면 요청을 보내고 승인을 받아야 합니다. 일반적으로 결제 후에 승인이 이루어집니다. 자세한 내용은 아래 작성자의 지침을 따르거나 goldbtcwhales에게 직접 문의하세요.
트레이딩뷰는 스크립트 작성자를 완전히 신뢰하고 스크립트 작동 방식을 이해하지 않는 한 스크립트 비용을 지불하거나 사용하지 않는 것을 권장하지 않습니다. 무료 오픈소스 대체 스크립트는 커뮤니티 스크립트에서 찾을 수 있습니다.
작성자 지시 사항
I do not actively read my private messages here.For access or free trial requests, please contact me on Telegram @stradeidea Access is granted only to verified members or students of the EDGAR Trading System.Once approved, the indicator will automatically
면책사항
이 정보와 게시물은 TradingView에서 제공하거나 보증하는 금융, 투자, 거래 또는 기타 유형의 조언이나 권고 사항을 의미하거나 구성하지 않습니다. 자세한 내용은 이용 약관을 참고하세요.