PROTECTED SOURCE SCRIPT
C-Multi TimeFrame RSI V1.0
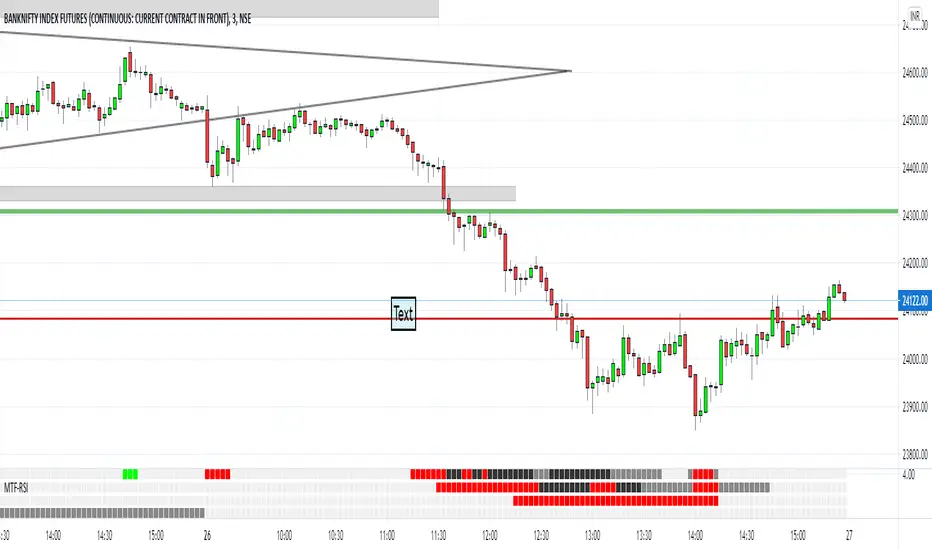
C-Multi TimeFrame RSI V1.0 shows multi time frame RSI signals. It indicates color based on 21EMA on RSI and the RSI values.
RSI is above 75 - Black (Over Bought)
RSI is between 61 and 75, additionally if RSI is greater than 21 EMA on RSI, it shows Green. otherwise it shows gray
RIS is between 61 and 38, No indication
RSI is between 38 and 25, additionally if RSI is less than 21 EMA on RSI, it shows Red. otherwise it shows gray
RSI is below 25 - Black (Over Sold)
By Default the Indicator shows,
5 Minutes RSI on top, 15 Minutes, 1 Hour and 4 Hours RSI interpretation subsequently.
보호된 스크립트입니다
이 스크립트는 비공개 소스로 게시됩니다. 하지만 이를 자유롭게 제한 없이 사용할 수 있습니다 – 자세한 내용은 여기에서 확인하세요.
면책사항
해당 정보와 게시물은 금융, 투자, 트레이딩 또는 기타 유형의 조언이나 권장 사항으로 간주되지 않으며, 트레이딩뷰에서 제공하거나 보증하는 것이 아닙니다. 자세한 내용은 이용 약관을 참조하세요.
보호된 스크립트입니다
이 스크립트는 비공개 소스로 게시됩니다. 하지만 이를 자유롭게 제한 없이 사용할 수 있습니다 – 자세한 내용은 여기에서 확인하세요.
면책사항
해당 정보와 게시물은 금융, 투자, 트레이딩 또는 기타 유형의 조언이나 권장 사항으로 간주되지 않으며, 트레이딩뷰에서 제공하거나 보증하는 것이 아닙니다. 자세한 내용은 이용 약관을 참조하세요.