INVITE-ONLY SCRIPT
[astropark] trade yesterday range

Dear followers,
today a nice scalping tool for day trading on low time frames (1-3-5 minutes)!
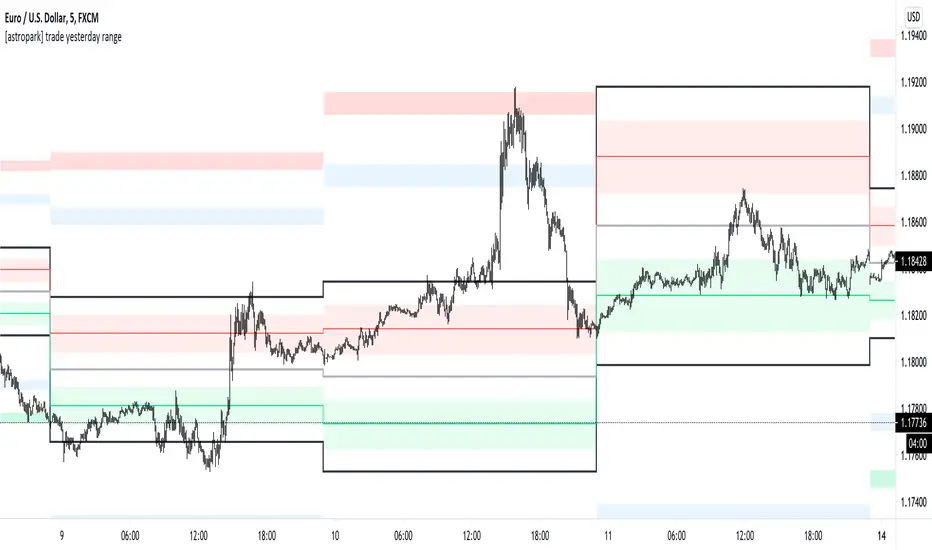
Each day the indicator will print some important levels and ranges related to the trading day before:
Trading levels is one of most effective trading tecniques:
Here you can see the levels described above and basic usage in a consolidation trading day:

A trader who wants to be a winner must understand that money and risk management are very important, so manage your position size and always have a stop loss in your trades.
Here you can see many examples on how to use this indicator.
Triple top on yesterday range high: perfect short setup (5 take profits targets in the example)

Resistance levels broken: long setup on bullish retest (2 take profits targets in the example)

Double top and support broken: 2 short setups (2 and 3 take profits targets in the example)

Here some examples how to basically use the indicator in a consolidation trading day: short (sell) resistance levels, long (buy) support levels


This is a premium indicator, so send me a private message in order to get access to this script.
today a nice scalping tool for day trading on low time frames (1-3-5 minutes)!
Each day the indicator will print some important levels and ranges related to the trading day before:
- yesterday high (black line)
- yesterday day range averange (silver line)
- yesterday low (black line)
- average between yesterday high and yesterday average, together with a resistance range (red)
- average between yesterday low and yesterday average, together with a support range (green)
- two extension ranges above yesterday high (first is blue, second is red)
- two extension ranges below yesterday low (first is blue, second is green)
Trading levels is one of most effective trading tecniques:
- once a level is broken upwards, you can long (buy) the bullish retest with stoploss below recent low
- once a level is broken downwards, you can short (sell) the bearish retest with stoploss below recent high
- consolidation below or at a resistance level is bullish, so long (buy) breakout upwards and long more on a bullish retest of broken level
- consolidation above or at a support level is bearish, so short (sell) breakout downwards and short more on a bearish retest of broken level
- many times you see a level to be tested 2 or 3 times: short (sell) double and triple top, long (buy) double or triple bottom
Here you can see the levels described above and basic usage in a consolidation trading day:
A trader who wants to be a winner must understand that money and risk management are very important, so manage your position size and always have a stop loss in your trades.
Here you can see many examples on how to use this indicator.
Triple top on yesterday range high: perfect short setup (5 take profits targets in the example)
Resistance levels broken: long setup on bullish retest (2 take profits targets in the example)
Double top and support broken: 2 short setups (2 and 3 take profits targets in the example)
Here some examples how to basically use the indicator in a consolidation trading day: short (sell) resistance levels, long (buy) support levels
This is a premium indicator, so send me a private message in order to get access to this script.
초대 전용 스크립트
이 스크립트는 작성자가 승인한 사용자만 접근할 수 있습니다. 사용하려면 요청 후 승인을 받아야 하며, 일반적으로 결제 후에 허가가 부여됩니다. 자세한 내용은 아래 작성자의 안내를 따르거나 astropark에게 직접 문의하세요.
트레이딩뷰는 스크립트의 작동 방식을 충분히 이해하고 작성자를 완전히 신뢰하지 않는 이상, 해당 스크립트에 비용을 지불하거나 사용하는 것을 권장하지 않습니다. 커뮤니티 스크립트에서 무료 오픈소스 대안을 찾아보실 수도 있습니다.
작성자 지시 사항
I'm a software engineer, passionate for trading & developing trading tools & bots! Feel free to DM me & checkout my work: bit.ly/astroparktrading
면책사항
해당 정보와 게시물은 금융, 투자, 트레이딩 또는 기타 유형의 조언이나 권장 사항으로 간주되지 않으며, 트레이딩뷰에서 제공하거나 보증하는 것이 아닙니다. 자세한 내용은 이용 약관을 참조하세요.