OPEN-SOURCE SCRIPT
EMA FAST-SLOW
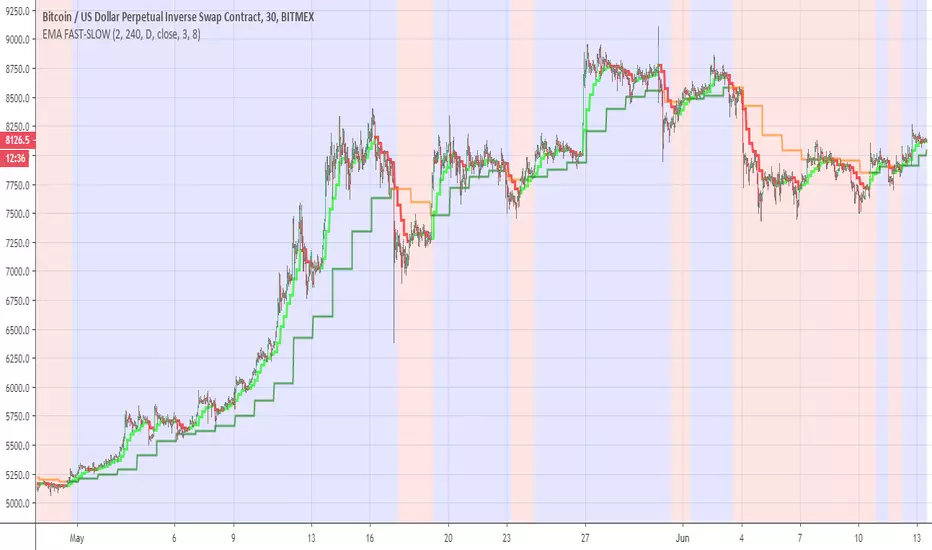
This indicator has the following
ema fast (length 3 and 8 ) based on 240 min
ema slow (length 3 and 8 ) based on daily MTF
The reason for the two length in each EMA is to give us the the insight of shorter trend in larger trend
so the large trend is when ema fast 240 min is above the daily ema slow this is shown in the bullish or bearish zones
the smaler trend for each MTF is shown in different color (lime:red) for ema fast 240 min , and (green:orange) for the slow daily EMA
when we this setting on smaller time frame so it more easy to see where the asset is going this the basic idea
you can change the setting as you wish in oreder to find the best one for your time frame
오픈 소스 스크립트
트레이딩뷰의 진정한 정신에 따라, 이 스크립트의 작성자는 이를 오픈소스로 공개하여 트레이더들이 기능을 검토하고 검증할 수 있도록 했습니다. 작성자에게 찬사를 보냅니다! 이 코드는 무료로 사용할 수 있지만, 코드를 재게시하는 경우 하우스 룰이 적용된다는 점을 기억하세요.
면책사항
해당 정보와 게시물은 금융, 투자, 트레이딩 또는 기타 유형의 조언이나 권장 사항으로 간주되지 않으며, 트레이딩뷰에서 제공하거나 보증하는 것이 아닙니다. 자세한 내용은 이용 약관을 참조하세요.
오픈 소스 스크립트
트레이딩뷰의 진정한 정신에 따라, 이 스크립트의 작성자는 이를 오픈소스로 공개하여 트레이더들이 기능을 검토하고 검증할 수 있도록 했습니다. 작성자에게 찬사를 보냅니다! 이 코드는 무료로 사용할 수 있지만, 코드를 재게시하는 경우 하우스 룰이 적용된다는 점을 기억하세요.
면책사항
해당 정보와 게시물은 금융, 투자, 트레이딩 또는 기타 유형의 조언이나 권장 사항으로 간주되지 않으며, 트레이딩뷰에서 제공하거나 보증하는 것이 아닙니다. 자세한 내용은 이용 약관을 참조하세요.