OPEN-SOURCE SCRIPT
업데이트됨 Crunchster's Real Price
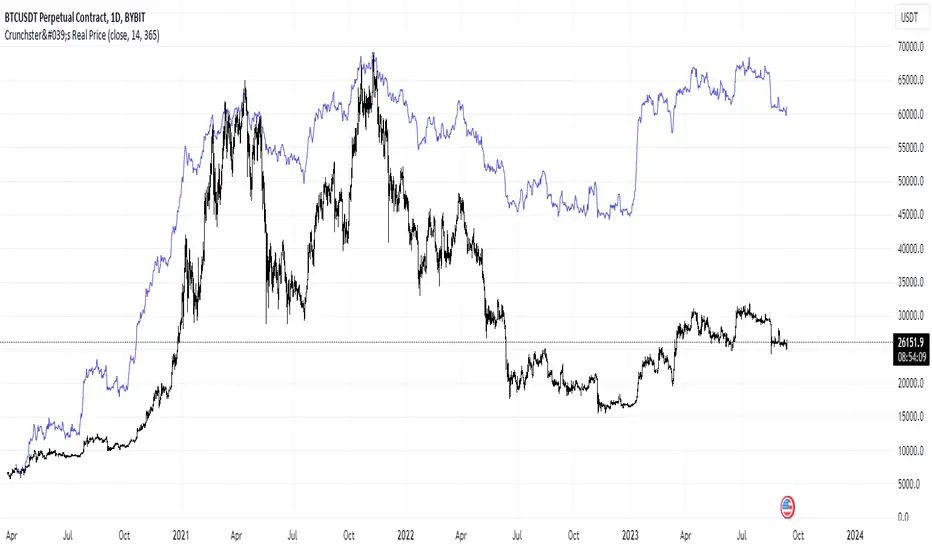
This is a simple transformation of any price series (best suited to daily timeframe) that filters out random price fluctuations and revealing the "real" price action. It allows comparison between different assets easily and is a useful confirmation of support and resistance levels, or can be used with other technical analysis.
In the default settings based on a daily chart, the daily returns are first calculated, then volatility normalised by dividing by the standard deviation of daily returns over the defined lookback period (14 periods by default).
These normalised returns are then added together over the entire price series period, to create a new "Real price" - the volatility adjusted price. This is the default presentation.
In addition, a second signal ("Normalised price series over rolling period") is available which, instead of summing the normalised returns over the entire price series, allows a user configurable, rolling lookback window over which the normalised returns are summed up. The default setting is 365 periods (ie 1 year on the daily timeframe for tickers with 24hr markets such as crypto. This can be set to 252 periods if analysing equities, which only trade 5 days per week, or any other user defined period of interest).
릴리즈 노트
Added configurable source릴리즈 노트
Updated to overlay main chart오픈 소스 스크립트
트레이딩뷰의 진정한 정신에 따라, 이 스크립트의 작성자는 이를 오픈소스로 공개하여 트레이더들이 기능을 검토하고 검증할 수 있도록 했습니다. 작성자에게 찬사를 보냅니다! 이 코드는 무료로 사용할 수 있지만, 코드를 재게시하는 경우 하우스 룰이 적용된다는 점을 기억하세요.
Join me on Mizar.com and trade my strategies
면책사항
해당 정보와 게시물은 금융, 투자, 트레이딩 또는 기타 유형의 조언이나 권장 사항으로 간주되지 않으며, 트레이딩뷰에서 제공하거나 보증하는 것이 아닙니다. 자세한 내용은 이용 약관을 참조하세요.
오픈 소스 스크립트
트레이딩뷰의 진정한 정신에 따라, 이 스크립트의 작성자는 이를 오픈소스로 공개하여 트레이더들이 기능을 검토하고 검증할 수 있도록 했습니다. 작성자에게 찬사를 보냅니다! 이 코드는 무료로 사용할 수 있지만, 코드를 재게시하는 경우 하우스 룰이 적용된다는 점을 기억하세요.
Join me on Mizar.com and trade my strategies
면책사항
해당 정보와 게시물은 금융, 투자, 트레이딩 또는 기타 유형의 조언이나 권장 사항으로 간주되지 않으며, 트레이딩뷰에서 제공하거나 보증하는 것이 아닙니다. 자세한 내용은 이용 약관을 참조하세요.