OPEN-SOURCE SCRIPT
S&P 2024: Magnificent 7 vs. the rest of S&P

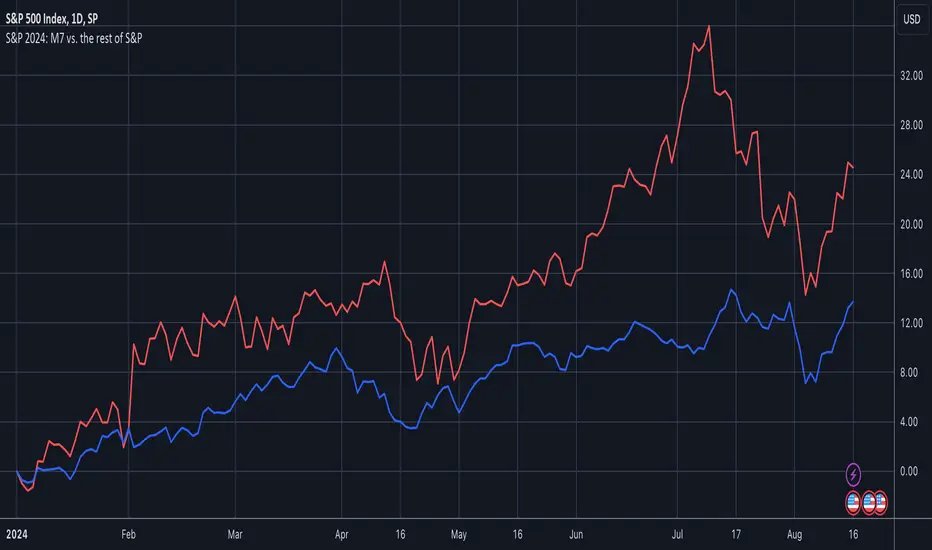
This chart is designed to calculate and display the percentage change of the Magnificent 7 (M7) stocks and the S&P 500 excluding the M7 (Ex-M7) from the beginning of 2024 to the most recent data point. The Magnificent 7 consists of seven major technology stocks: Apple (AAPL), Microsoft (MSFT), Amazon (AMZN), Alphabet (GOOGL), Meta (META), Nvidia (NVDA), and Tesla (TSLA). These stocks are a significant part of the S&P 500 and can have a substantial impact on its overall performance.
Key Components and Functionality:
1. Start of 2024 Baseline:
- The script identifies the closing prices of the S&P 500 and each of the Magnificent 7 stocks on the first trading day of 2024. These values serve as the baseline for calculating percentage changes.
2. Current Value Calculation:
- It then fetches the most recent closing prices of these stocks and the S&P 500 index to calculate their current values.
3. Percentage Change Calculation:
- The script calculates the percentage change for the M7 by comparing the sum of the current prices of the M7 stocks to their combined value at the start of 2024.
- Similarly, it calculates the percentage change for the Ex-M7 by comparing the current value of the S&P 500 excluding the M7 to its value at the start of 2024.
4. Plotting:
- The calculated percentage changes are plotted on the chart, with the M7’s percentage change shown in red and the Ex-M7’s percentage change shown in blue.
Use Case:
This indicator is particularly useful for investors and analysts who want to understand how much the performance of the S&P 500 in 2024 is driven by the Magnificent 7 stocks compared to the rest of the index. By showing the percentage change from the start of the year, it provides clear insights into the relative growth or decline of these two segments of the market over the course of the year.
Visualization:
- Red Line (M7 % Change): Displays the percentage change of the combined value of the Magnificent 7 stocks since the start of 2024.
- Blue Line (Ex-M7 % Change): Displays the percentage change of the S&P 500 excluding the Magnificent 7 since the start of 2024.
This script enables a straightforward comparison of the performance of the M7 and Ex-M7, highlighting which segment is contributing more to the overall movement of the S&P 500 in 2024.
오픈 소스 스크립트
트레이딩뷰의 진정한 정신에 따라, 이 스크립트의 작성자는 이를 오픈소스로 공개하여 트레이더들이 기능을 검토하고 검증할 수 있도록 했습니다. 작성자에게 찬사를 보냅니다! 이 코드는 무료로 사용할 수 있지만, 코드를 재게시하는 경우 하우스 룰이 적용된다는 점을 기억하세요.
면책사항
해당 정보와 게시물은 금융, 투자, 트레이딩 또는 기타 유형의 조언이나 권장 사항으로 간주되지 않으며, 트레이딩뷰에서 제공하거나 보증하는 것이 아닙니다. 자세한 내용은 이용 약관을 참조하세요.
오픈 소스 스크립트
트레이딩뷰의 진정한 정신에 따라, 이 스크립트의 작성자는 이를 오픈소스로 공개하여 트레이더들이 기능을 검토하고 검증할 수 있도록 했습니다. 작성자에게 찬사를 보냅니다! 이 코드는 무료로 사용할 수 있지만, 코드를 재게시하는 경우 하우스 룰이 적용된다는 점을 기억하세요.
면책사항
해당 정보와 게시물은 금융, 투자, 트레이딩 또는 기타 유형의 조언이나 권장 사항으로 간주되지 않으며, 트레이딩뷰에서 제공하거나 보증하는 것이 아닙니다. 자세한 내용은 이용 약관을 참조하세요.