OPEN-SOURCE SCRIPT
Multiple Ema's
This indicator plots five customizable Exponential Moving Averages (EMAs) directly on your chart, helping you analyze price trends and identify potential support/resistance zones more effectively.
Features:
Five EMAs with adjustable lengths: Quickly set the periods for each EMA (default: 10, 20, 50, 100, 200).
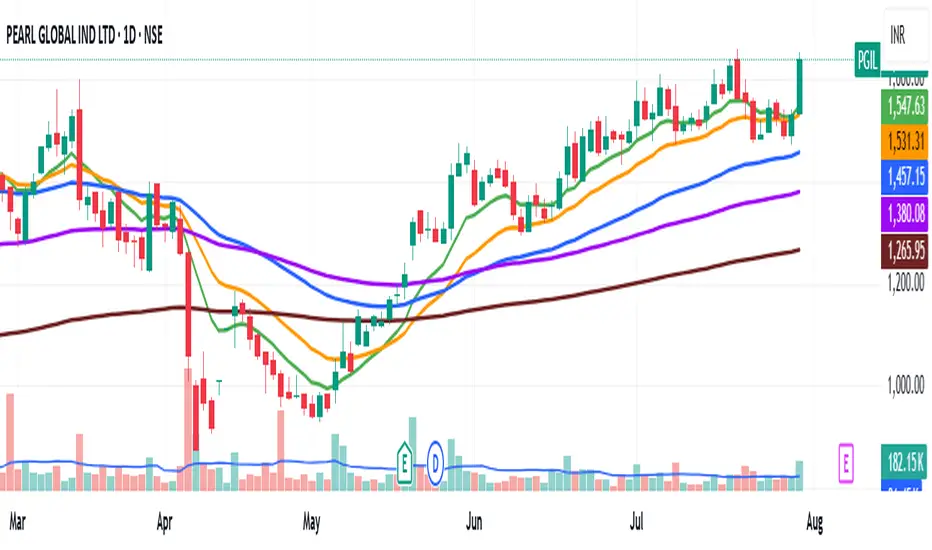
Clear, color-coded lines: Each EMA is plotted with a distinct color for easy visualization:
EMA 1 (Green)
EMA 2 (Orange)
EMA 3 (Blue)
EMA 4 (Purple)
EMA 5 (Brown)
Overlay on price chart: All curves are shown directly on your main chart for seamless trend analysis.
How to Use:
Use this indicator to:
Identify short-, medium-, and long-term trends by observing the relationships and crossovers between the EMAs.
Spot momentum shifts and potential entry/exit opportunities when price crosses above or below multiple EMAs.
Fine-tune EMA periods to your own trading strategy using the input settings.
Ideal for:
Traders and investors seeking a flexible, multi-timeframe EMA solution for stocks, forex, crypto, or any market.
Tip: Experiment with EMA lengths to match your trading style or combine with other indicators for even stronger signals!
Features:
Five EMAs with adjustable lengths: Quickly set the periods for each EMA (default: 10, 20, 50, 100, 200).
Clear, color-coded lines: Each EMA is plotted with a distinct color for easy visualization:
EMA 1 (Green)
EMA 2 (Orange)
EMA 3 (Blue)
EMA 4 (Purple)
EMA 5 (Brown)
Overlay on price chart: All curves are shown directly on your main chart for seamless trend analysis.
How to Use:
Use this indicator to:
Identify short-, medium-, and long-term trends by observing the relationships and crossovers between the EMAs.
Spot momentum shifts and potential entry/exit opportunities when price crosses above or below multiple EMAs.
Fine-tune EMA periods to your own trading strategy using the input settings.
Ideal for:
Traders and investors seeking a flexible, multi-timeframe EMA solution for stocks, forex, crypto, or any market.
Tip: Experiment with EMA lengths to match your trading style or combine with other indicators for even stronger signals!
오픈 소스 스크립트
트레이딩뷰의 진정한 정신에 따라, 이 스크립트의 작성자는 이를 오픈소스로 공개하여 트레이더들이 기능을 검토하고 검증할 수 있도록 했습니다. 작성자에게 찬사를 보냅니다! 이 코드는 무료로 사용할 수 있지만, 코드를 재게시하는 경우 하우스 룰이 적용된다는 점을 기억하세요.
면책사항
해당 정보와 게시물은 금융, 투자, 트레이딩 또는 기타 유형의 조언이나 권장 사항으로 간주되지 않으며, 트레이딩뷰에서 제공하거나 보증하는 것이 아닙니다. 자세한 내용은 이용 약관을 참조하세요.
오픈 소스 스크립트
트레이딩뷰의 진정한 정신에 따라, 이 스크립트의 작성자는 이를 오픈소스로 공개하여 트레이더들이 기능을 검토하고 검증할 수 있도록 했습니다. 작성자에게 찬사를 보냅니다! 이 코드는 무료로 사용할 수 있지만, 코드를 재게시하는 경우 하우스 룰이 적용된다는 점을 기억하세요.
면책사항
해당 정보와 게시물은 금융, 투자, 트레이딩 또는 기타 유형의 조언이나 권장 사항으로 간주되지 않으며, 트레이딩뷰에서 제공하거나 보증하는 것이 아닙니다. 자세한 내용은 이용 약관을 참조하세요.