OPEN-SOURCE SCRIPT
Advanced RSI with Divergence RCT
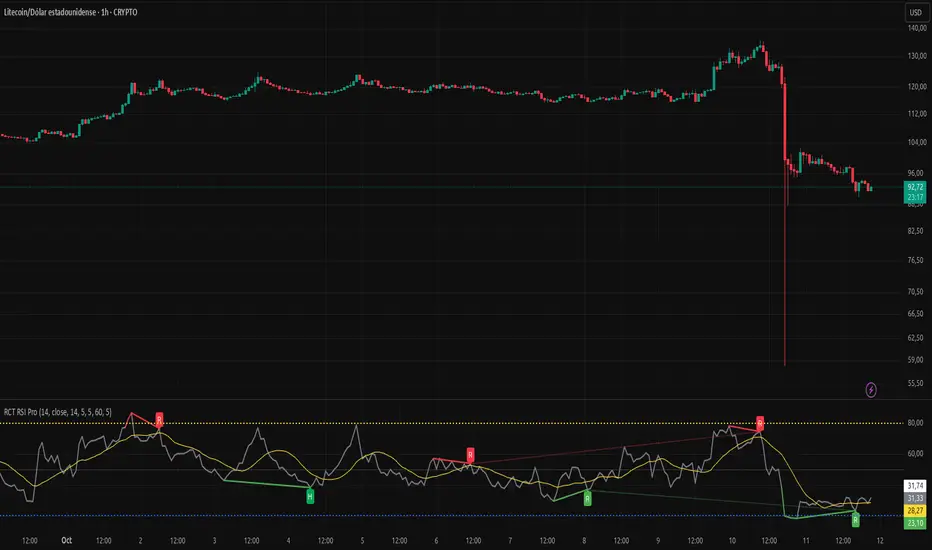
This indicator provides a comprehensive RSI analysis tool by combining the classic Relative Strength Index (RSI) with a smoothing Simple Moving Average (SMA), clearly defined overbought/oversold zones, and an advanced divergence detection engine.
--- Key Features ---
1. RSI with SMA: Plots the standard RSI along with a user-defined SMA of the RSI. This helps to smooth out price action and confirm the underlying trend, identifying potential buy/sell signals on crossovers.
2. Overbought/Oversold Levels: Highlights the extreme zones with dotted horizontal lines at 80 (overbought) and 20 (oversold), providing clear visual cues for potential market reversals.
3. Advanced Divergence Detection: Automatically identifies and plots both regular and hidden divergences (bullish and bearish) directly on the chart. This helps traders spot potential reversals that are not obvious from price action alone.
--- How to Use ---
- Trend Confirmation: When the RSI crosses above its SMA, it can signal a strengthening bullish trend. A cross below can signal a strengthening bearish trend.
- Reversal Zones: When the RSI enters the overbought zone (>80) or oversold zone (<20), traders may watch for a reversal in price.
- Divergence Signals:
- A Bullish Divergence (green label 'R') occurs when the price makes a lower low, but the RSI makes a higher low, suggesting downward momentum is fading.
- A Bearish Divergence (red label 'R') occurs when the price makes a higher high, but the RSI makes a lower high, suggesting upward momentum is fading.
- Hidden Divergences ('H' labels) can indicate the continuation of an existing trend.
--- Disclaimer ---
This script is for informational and educational purposes only. It is not financial advice. Past performance is not indicative of future results. Always do your own research before making any trading decisions.
오픈 소스 스크립트
진정한 트레이딩뷰 정신에 따라 이 스크립트 작성자는 트레이더가 기능을 검토하고 검증할 수 있도록 오픈소스로 공개했습니다. 작성자에게 찬사를 보냅니다! 무료로 사용할 수 있지만 코드를 다시 게시할 경우 하우스 룰이 적용된다는 점을 기억하세요.
면책사항
이 정보와 게시물은 TradingView에서 제공하거나 보증하는 금융, 투자, 거래 또는 기타 유형의 조언이나 권고 사항을 의미하거나 구성하지 않습니다. 자세한 내용은 이용 약관을 참고하세요.
오픈 소스 스크립트
진정한 트레이딩뷰 정신에 따라 이 스크립트 작성자는 트레이더가 기능을 검토하고 검증할 수 있도록 오픈소스로 공개했습니다. 작성자에게 찬사를 보냅니다! 무료로 사용할 수 있지만 코드를 다시 게시할 경우 하우스 룰이 적용된다는 점을 기억하세요.
면책사항
이 정보와 게시물은 TradingView에서 제공하거나 보증하는 금융, 투자, 거래 또는 기타 유형의 조언이나 권고 사항을 의미하거나 구성하지 않습니다. 자세한 내용은 이용 약관을 참고하세요.