OPEN-SOURCE SCRIPT
업데이트됨 MACD At Scales with Alerts
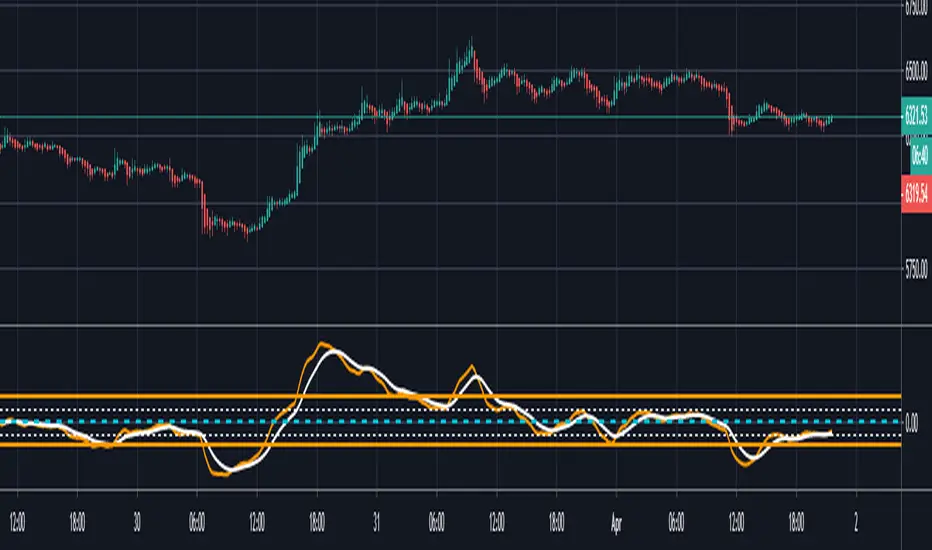
I use the horizontal scale lines on the MACD indicator as part of my scalping strategy along with other indicators like RSI/EMA and Market Cipher B when trading BTC
I am looking for a cross above or below the 12.5 and 25 horizontal scale lines, along with lining up other indicators
I set my alerts on the 5 min TF and look to the 15 and 30 min TF's for further confirmation.
I have find the scale lines to be very useful for visual reference of the crosses, above/below 25 lines is mostly a safer trade, crosses above/below 12.5 lines can have more risk, crosses between 0 baseline and 12.5 can have a higher return but have much more risk.
Don't ever use just this indicator by itself, you must always have at least 2 indicators running
This is an example of the TF's not lining up, so a entry here would be high risk
https://www.tradingview.com/x/zg2Kwp4M/
This is an example of the TF's lining up, so a entry here would be less risk
https://www.tradingview.com/x/GyUr3Y2B/
릴리즈 노트
This is an example of 5m, 15m and 30m TF's not lining up, so a entry here would be high riskThis is an example of 5m, 15m and 30m TF's lining up, so a entry here would be lower risk, please observe the times under the white vertical lines i would be entering using the 15m
And never forget, if you use this indicator alone to make entry, its always higher risk
릴리즈 노트
Update: fixed code alerts so at 25 and -25 levels it doesn't give you double alerts for both 12.5 and 25오픈 소스 스크립트
트레이딩뷰의 진정한 정신에 따라, 이 스크립트의 작성자는 이를 오픈소스로 공개하여 트레이더들이 기능을 검토하고 검증할 수 있도록 했습니다. 작성자에게 찬사를 보냅니다! 이 코드는 무료로 사용할 수 있지만, 코드를 재게시하는 경우 하우스 룰이 적용된다는 점을 기억하세요.
면책사항
해당 정보와 게시물은 금융, 투자, 트레이딩 또는 기타 유형의 조언이나 권장 사항으로 간주되지 않으며, 트레이딩뷰에서 제공하거나 보증하는 것이 아닙니다. 자세한 내용은 이용 약관을 참조하세요.
오픈 소스 스크립트
트레이딩뷰의 진정한 정신에 따라, 이 스크립트의 작성자는 이를 오픈소스로 공개하여 트레이더들이 기능을 검토하고 검증할 수 있도록 했습니다. 작성자에게 찬사를 보냅니다! 이 코드는 무료로 사용할 수 있지만, 코드를 재게시하는 경우 하우스 룰이 적용된다는 점을 기억하세요.
면책사항
해당 정보와 게시물은 금융, 투자, 트레이딩 또는 기타 유형의 조언이나 권장 사항으로 간주되지 않으며, 트레이딩뷰에서 제공하거나 보증하는 것이 아닙니다. 자세한 내용은 이용 약관을 참조하세요.