INVITE-ONLY SCRIPT
Candlestick Percentile Rank
CANDLESTICK PERCENTILE RANK
█ OVERVIEW
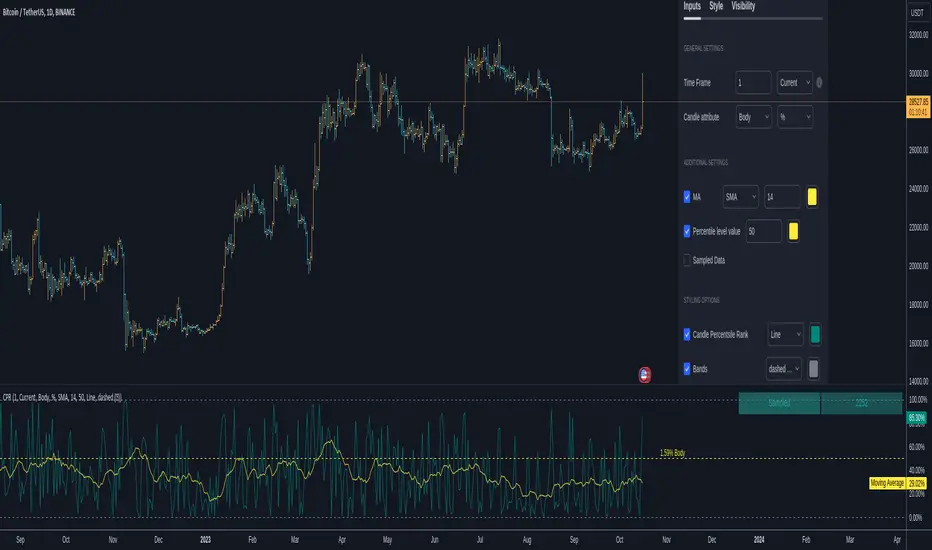
This script is designed to sample all available candles within a chosen time frame and provide a candlestick percentile rank to each candle. This script works by measuring a candle's body or its low to high value to the upside, or to the downside in percentage or in dollar value. Once the candle is measured its given a value based on all the previous measurements. You will be able to know if a body ( or a full candle/bar ) is above, or below a certain percentile level. By doing this you're effectively going to know if a candle is under performing or under-performing compared to the chart's history.
Example : A candle that did a 30% move vs another did a 10% and a third did a 5%. Here we 3 candles. The one that did a 30% is going to be ranked at 100 because it's the highest while the 5% candle ranks at 0 and the 10% candles ranks at 50. you see how this works. Having a candle in the 90th percentile means at that time it scored better than 90% of the preceding candles based on its move ( in dollar or percentage ).
So imagine you have an organic move of an up trend, ideally and what you want to see is this ; a candle with a low rank followed by one that's higher, followed by one that's also higher until the trend stops and you see a pin bar or whatever topping candle. You expect to see a rank going from low value to high value to suddenly sharply decrease to low value.
Constant low values may indicate lower volatility or time to change. For example, a doji candle will create a very low percentile rank value ( body-wise ). A high percentile rank value means high volatility on body and full candle calculations.

^ This is only one use of it.
A trendline may also form with a breakout points and information about the trend of the volatility of recent candles. Moving averages when applied to these calculations and to the percentile ranks can absolutely help in making these trends a bit smoother which is why you can add them to the graph. if you wish.

This script can be used in multiple ways including as a measure of volatility. or for statistical purposes. If I know the 50th percentile of a candle value I can know a very critical information about an asset's behavior and how volatile it is compared to another. There are many questions that can be answered using this script. How many times has this asset printed a candle of x% in the past y amount of time and how often does that happen. Is this candle or that truly rare ?
This script also has an option to highlight a specific percentile level showing its value. You can also see the number of sampled candles for clarity on the reliability of the data.
In conclusion, candlesticks effect each others. The whole candlestick/bars patterns is based on this. The percentile Rank is an effective way to observe and study these effects. The percentile rank shows you how on a measuring stick from 0 to 100 how a candle ( body or full low-high ) ranks compared to other candles in the past based on dollar value or percentage value. There are many untapped usages of the percentile rank when applied to candlesticks calculations and I hope this script can help you with this. If one can study the behavior of an asset and its bars percentile ranks they can unlock some probabilistic advantages.
█ Future Plans and upgrades to this script may include :
1. Count the times a percentile level is hit.
2. Display details about the highest/lowest levels.
and more! feel free to let me know what you'd like to see!
█ How to use :
1. Put the script on your chart
2. Navigate to the settings
give the script a few seconds and you should be set.
█ OVERVIEW
This script is designed to sample all available candles within a chosen time frame and provide a candlestick percentile rank to each candle. This script works by measuring a candle's body or its low to high value to the upside, or to the downside in percentage or in dollar value. Once the candle is measured its given a value based on all the previous measurements. You will be able to know if a body ( or a full candle/bar ) is above, or below a certain percentile level. By doing this you're effectively going to know if a candle is under performing or under-performing compared to the chart's history.
Example : A candle that did a 30% move vs another did a 10% and a third did a 5%. Here we 3 candles. The one that did a 30% is going to be ranked at 100 because it's the highest while the 5% candle ranks at 0 and the 10% candles ranks at 50. you see how this works. Having a candle in the 90th percentile means at that time it scored better than 90% of the preceding candles based on its move ( in dollar or percentage ).
So imagine you have an organic move of an up trend, ideally and what you want to see is this ; a candle with a low rank followed by one that's higher, followed by one that's also higher until the trend stops and you see a pin bar or whatever topping candle. You expect to see a rank going from low value to high value to suddenly sharply decrease to low value.
Constant low values may indicate lower volatility or time to change. For example, a doji candle will create a very low percentile rank value ( body-wise ). A high percentile rank value means high volatility on body and full candle calculations.
^ This is only one use of it.
A trendline may also form with a breakout points and information about the trend of the volatility of recent candles. Moving averages when applied to these calculations and to the percentile ranks can absolutely help in making these trends a bit smoother which is why you can add them to the graph. if you wish.
This script can be used in multiple ways including as a measure of volatility. or for statistical purposes. If I know the 50th percentile of a candle value I can know a very critical information about an asset's behavior and how volatile it is compared to another. There are many questions that can be answered using this script. How many times has this asset printed a candle of x% in the past y amount of time and how often does that happen. Is this candle or that truly rare ?
This script also has an option to highlight a specific percentile level showing its value. You can also see the number of sampled candles for clarity on the reliability of the data.
In conclusion, candlesticks effect each others. The whole candlestick/bars patterns is based on this. The percentile Rank is an effective way to observe and study these effects. The percentile rank shows you how on a measuring stick from 0 to 100 how a candle ( body or full low-high ) ranks compared to other candles in the past based on dollar value or percentage value. There are many untapped usages of the percentile rank when applied to candlesticks calculations and I hope this script can help you with this. If one can study the behavior of an asset and its bars percentile ranks they can unlock some probabilistic advantages.
█ Future Plans and upgrades to this script may include :
1. Count the times a percentile level is hit.
2. Display details about the highest/lowest levels.
and more! feel free to let me know what you'd like to see!
█ How to use :
1. Put the script on your chart
2. Navigate to the settings
give the script a few seconds and you should be set.
초대 전용 스크립트
이 스크립트는 작성자가 승인한 사용자만 접근할 수 있습니다. 사용하려면 요청 후 승인을 받아야 하며, 일반적으로 결제 후에 허가가 부여됩니다. 자세한 내용은 아래 작성자의 안내를 따르거나 NasserHumood에게 직접 문의하세요.
트레이딩뷰는 스크립트의 작동 방식을 충분히 이해하고 작성자를 완전히 신뢰하지 않는 이상, 해당 스크립트에 비용을 지불하거나 사용하는 것을 권장하지 않습니다. 커뮤니티 스크립트에서 무료 오픈소스 대안을 찾아보실 수도 있습니다.
작성자 지시 사항
Feel Free to contact me if you need access to this script, my information is down below.
면책사항
해당 정보와 게시물은 금융, 투자, 트레이딩 또는 기타 유형의 조언이나 권장 사항으로 간주되지 않으며, 트레이딩뷰에서 제공하거나 보증하는 것이 아닙니다. 자세한 내용은 이용 약관을 참조하세요.