OPEN-SOURCE SCRIPT
Bitcoin Cycle
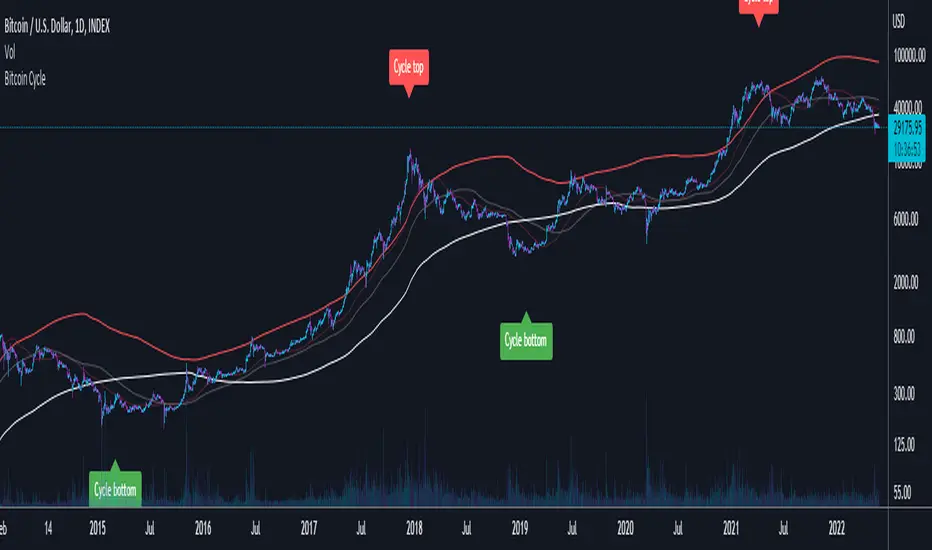
This script displays 4 different Moving Averages:
For the last cycles: once the 2 year MA crossed the 232 Day MA, it marked the cycle bottom within a few days and once the 1 year MA (x2) crossed the 116 Day MA, it marked the cycle top within a few days.
It is interesting to note that both 365/116 and 730/232 equal 3.1465, which is very close to Pi (3.142). It is actually the closest we can get to Pi when dividing 365 by another whole number.
- 2 Year Moving Average (White)
- 1 Year Moving Average (Doubled in value, Red)
- 116 Day Moving Average (Transparent, Red)
- 232 Day Moving Average (Transparent, White)
For the last cycles: once the 2 year MA crossed the 232 Day MA, it marked the cycle bottom within a few days and once the 1 year MA (x2) crossed the 116 Day MA, it marked the cycle top within a few days.
It is interesting to note that both 365/116 and 730/232 equal 3.1465, which is very close to Pi (3.142). It is actually the closest we can get to Pi when dividing 365 by another whole number.
오픈 소스 스크립트
트레이딩뷰의 진정한 정신에 따라, 이 스크립트의 작성자는 이를 오픈소스로 공개하여 트레이더들이 기능을 검토하고 검증할 수 있도록 했습니다. 작성자에게 찬사를 보냅니다! 이 코드는 무료로 사용할 수 있지만, 코드를 재게시하는 경우 하우스 룰이 적용된다는 점을 기억하세요.
면책사항
해당 정보와 게시물은 금융, 투자, 트레이딩 또는 기타 유형의 조언이나 권장 사항으로 간주되지 않으며, 트레이딩뷰에서 제공하거나 보증하는 것이 아닙니다. 자세한 내용은 이용 약관을 참조하세요.
오픈 소스 스크립트
트레이딩뷰의 진정한 정신에 따라, 이 스크립트의 작성자는 이를 오픈소스로 공개하여 트레이더들이 기능을 검토하고 검증할 수 있도록 했습니다. 작성자에게 찬사를 보냅니다! 이 코드는 무료로 사용할 수 있지만, 코드를 재게시하는 경우 하우스 룰이 적용된다는 점을 기억하세요.
면책사항
해당 정보와 게시물은 금융, 투자, 트레이딩 또는 기타 유형의 조언이나 권장 사항으로 간주되지 않으며, 트레이딩뷰에서 제공하거나 보증하는 것이 아닙니다. 자세한 내용은 이용 약관을 참조하세요.