PROTECTED SOURCE SCRIPT
Stochastics Oscillator with Buy/Sell Indicator [iSTAGs]
iSTAGs "Stochastics Oscillator" with Buy/Sell Indicator
Overview
The Stochastics Oscillator is a versatile trading indicator designed to provide comprehensive insights into market momentum and potential price reversals. With its multi-layered approach, it incorporates a blend of oscillators, smoothed averages, and relative strength measures to deliver actionable trading signals.
Disclaimer
This indicator is provided for study purposes only. While it may assist in identifying potential buy and sell opportunities, please note:
1. False Signals: The buy/sell indicators may generate false signals. Always validate signals using additional analysis or tools.
2. Trading Strategies: Use appropriate exit points and stop-loss levels as part of your overall trading strategy.
3. No Guarantees: Do not rely solely on this indicator for trading decisions. Market conditions may change, and no indicator guarantees accurate results.
4. Strategy Testing: The strategy associated with this indicator is not tested, and backtesting features are not available at this time.
Key Features
1. Stochastics Oscillator
• Combines the smoothed ranges of price movement to identify overbought and oversold conditions.
• Inbuilt signal lines helps pinpoint potential crossovers for trend reversals.

2. Zones Highlighting
• Clearly visualized zones for:
o Overbought (70–100): Caution for potential reversals.
o Bullish (0–40): Positive momentum.
o Bearish (0 to -40): Negative momentum.
o Oversold (-70 to -100): Potential buying opportunities.

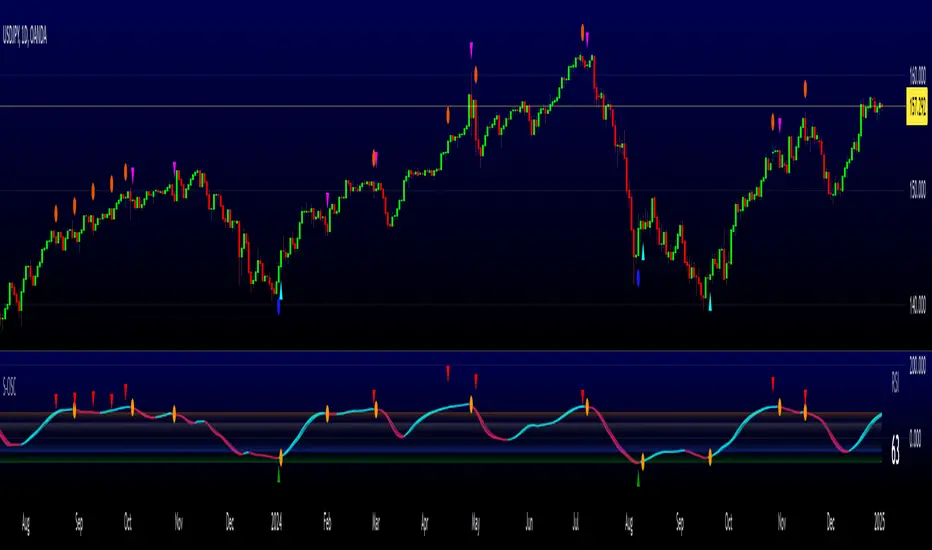
3. Buy and Sell Signals
• Primary Buy/Sell Indicator: Highlighted directly on the chart for ease of use.
• Potential Buy/Sell Signals: Secondary indicators based on advanced crossover conditions that can generate early signals.

4. RSI Integration
• Realtime RSI value display for an additional layer of confirmation.
• Color-coded RSI values to easily interpret market strength:
o Red: Overbought (>80)
o Orange: Strong momentum (70–80)
o White: Neutral (30–70)
o Blue: Weak momentum (20–30)
o Green: Oversold (<20)

5. Limited Customizable Visuals
o Clean and color-coded plots and fills make it intuitive to identify trends and trading opportunities at a glance.
How to Use
1. Trading Signals:
• Use buy/sell shapes and flags for identifying potential entry and exit points.
• Combine primary buy/sell indicator and secondary buy/sell signals for higher confidence.
2. Trend Confirmation:
• Monitor the oscillator and signal crossovers alongside zone fills to gauge market direction.
3. RSI Analysis:
• Keep an eye on the RSI value and its color coding for confirmation of overbought or oversold conditions.
Settings
• Enable/Disable Features: Customize the visibility of Buy/Sell indicators, Potential Signals, and RSI display.
• Editable Zones: Adjust zone colors and ranges to suit your trading strategy.
Conclusion
The Stochastics Oscillator is a powerful tool for traders seeking to enhance their technical analysis. Its layered approach provides clarity, precision, and adaptability for a wide range of trading strategies, whether you're a scalper, swing trader, or long-term investor.
________________________________________
Developed by iSTAGs
________________________________________
Happy Trading! 🎯
Overview
The Stochastics Oscillator is a versatile trading indicator designed to provide comprehensive insights into market momentum and potential price reversals. With its multi-layered approach, it incorporates a blend of oscillators, smoothed averages, and relative strength measures to deliver actionable trading signals.
Disclaimer
This indicator is provided for study purposes only. While it may assist in identifying potential buy and sell opportunities, please note:
1. False Signals: The buy/sell indicators may generate false signals. Always validate signals using additional analysis or tools.
2. Trading Strategies: Use appropriate exit points and stop-loss levels as part of your overall trading strategy.
3. No Guarantees: Do not rely solely on this indicator for trading decisions. Market conditions may change, and no indicator guarantees accurate results.
4. Strategy Testing: The strategy associated with this indicator is not tested, and backtesting features are not available at this time.
Key Features
1. Stochastics Oscillator
• Combines the smoothed ranges of price movement to identify overbought and oversold conditions.
• Inbuilt signal lines helps pinpoint potential crossovers for trend reversals.
2. Zones Highlighting
• Clearly visualized zones for:
o Overbought (70–100): Caution for potential reversals.
o Bullish (0–40): Positive momentum.
o Bearish (0 to -40): Negative momentum.
o Oversold (-70 to -100): Potential buying opportunities.
3. Buy and Sell Signals
• Primary Buy/Sell Indicator: Highlighted directly on the chart for ease of use.
• Potential Buy/Sell Signals: Secondary indicators based on advanced crossover conditions that can generate early signals.
4. RSI Integration
• Realtime RSI value display for an additional layer of confirmation.
• Color-coded RSI values to easily interpret market strength:
o Red: Overbought (>80)
o Orange: Strong momentum (70–80)
o White: Neutral (30–70)
o Blue: Weak momentum (20–30)
o Green: Oversold (<20)
5. Limited Customizable Visuals
o Clean and color-coded plots and fills make it intuitive to identify trends and trading opportunities at a glance.
How to Use
1. Trading Signals:
• Use buy/sell shapes and flags for identifying potential entry and exit points.
• Combine primary buy/sell indicator and secondary buy/sell signals for higher confidence.
2. Trend Confirmation:
• Monitor the oscillator and signal crossovers alongside zone fills to gauge market direction.
3. RSI Analysis:
• Keep an eye on the RSI value and its color coding for confirmation of overbought or oversold conditions.
Settings
• Enable/Disable Features: Customize the visibility of Buy/Sell indicators, Potential Signals, and RSI display.
• Editable Zones: Adjust zone colors and ranges to suit your trading strategy.
Conclusion
The Stochastics Oscillator is a powerful tool for traders seeking to enhance their technical analysis. Its layered approach provides clarity, precision, and adaptability for a wide range of trading strategies, whether you're a scalper, swing trader, or long-term investor.
________________________________________
Developed by iSTAGs
________________________________________
Happy Trading! 🎯
보호된 스크립트입니다
이 스크립트는 비공개 소스로 게시됩니다. 하지만 이를 자유롭게 제한 없이 사용할 수 있습니다 – 자세한 내용은 여기에서 확인하세요.
면책사항
해당 정보와 게시물은 금융, 투자, 트레이딩 또는 기타 유형의 조언이나 권장 사항으로 간주되지 않으며, 트레이딩뷰에서 제공하거나 보증하는 것이 아닙니다. 자세한 내용은 이용 약관을 참조하세요.
면책사항
해당 정보와 게시물은 금융, 투자, 트레이딩 또는 기타 유형의 조언이나 권장 사항으로 간주되지 않으며, 트레이딩뷰에서 제공하거나 보증하는 것이 아닙니다. 자세한 내용은 이용 약관을 참조하세요.