OPEN-SOURCE SCRIPT
업데이트됨 RAT Momentum Squeeze BETA
V1.0
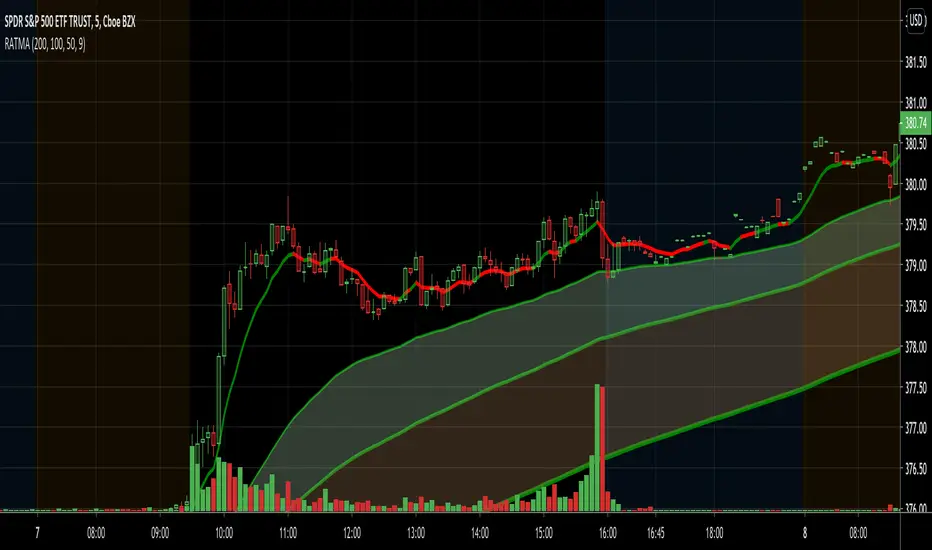
MAs are a great tool to measure the market's momentum. I created this indicator to graphically depict bullish and banishment movements with the moving averages.
Using the 50, 100, & 200 day MA in conjunction with the RSI we are able to find great swing setups. This is used best on the 30min & up to the daily chart.
릴리즈 노트
*Cleaned up code릴리즈 노트
V1.0 Release NotesAdded 9-day moving average with dynamic color based on 9-day RSI over/oversold levels
Added dynamic color changing to all moving averages based on the directional movement
릴리즈 노트
Added conditional formatting to the colors on the 9-day moving average. The greener the color, the more overbought. The darker the red, the more oversold. I will tweak the colors of the cloud and line itself in a future update.릴리즈 노트
Exciting new update :)-Added improved accuracy for the strength in the trend by calculating different RSI lengths
-Added bar overlays to help show the strength of the trend
-Improved colors on the 9 day MA overlay

릴리즈 노트
Switched MAs to EMAs. After doing extensive backtesting I think EMAs are much more accurate for the purpose of this indicator 릴리즈 노트
Changed SMAs to EMAs for improved accuracy 릴리즈 노트
changed RSI sensitivity 오픈 소스 스크립트
트레이딩뷰의 진정한 정신에 따라, 이 스크립트의 작성자는 이를 오픈소스로 공개하여 트레이더들이 기능을 검토하고 검증할 수 있도록 했습니다. 작성자에게 찬사를 보냅니다! 이 코드는 무료로 사용할 수 있지만, 코드를 재게시하는 경우 하우스 룰이 적용된다는 점을 기억하세요.
면책사항
해당 정보와 게시물은 금융, 투자, 트레이딩 또는 기타 유형의 조언이나 권장 사항으로 간주되지 않으며, 트레이딩뷰에서 제공하거나 보증하는 것이 아닙니다. 자세한 내용은 이용 약관을 참조하세요.
오픈 소스 스크립트
트레이딩뷰의 진정한 정신에 따라, 이 스크립트의 작성자는 이를 오픈소스로 공개하여 트레이더들이 기능을 검토하고 검증할 수 있도록 했습니다. 작성자에게 찬사를 보냅니다! 이 코드는 무료로 사용할 수 있지만, 코드를 재게시하는 경우 하우스 룰이 적용된다는 점을 기억하세요.
면책사항
해당 정보와 게시물은 금융, 투자, 트레이딩 또는 기타 유형의 조언이나 권장 사항으로 간주되지 않으며, 트레이딩뷰에서 제공하거나 보증하는 것이 아닙니다. 자세한 내용은 이용 약관을 참조하세요.