OPEN-SOURCE SCRIPT
Hull Kaufman SuperTrend Cloud (HKST Cloud)
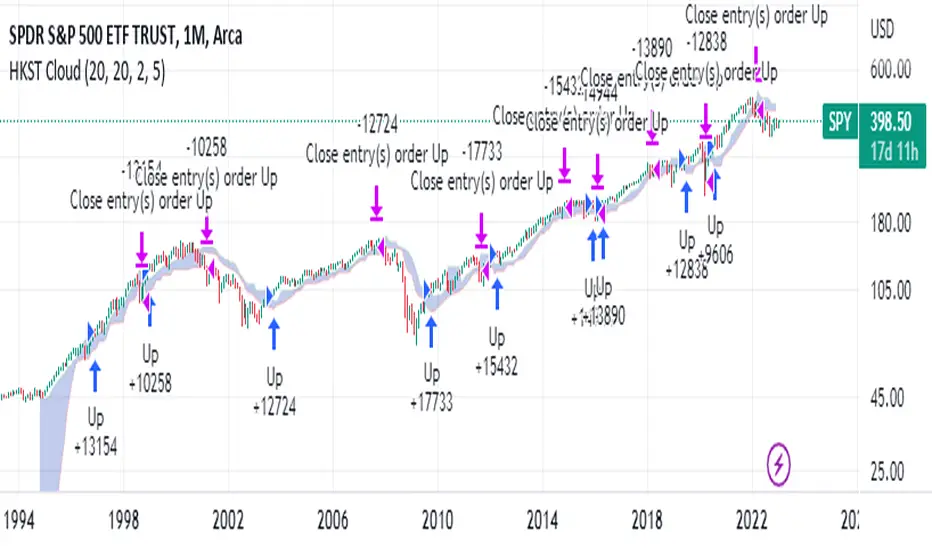
TLDR: This is a long only trend following system that uses highest and lowest values of three trend following indicators to form a "cloud". Enter when the candle high crosses above the highest band. Close if the low or close crosses below the lowest band.
3 indicators
1. Kaufman Adaptive moving Average - set at 20
2. Hull Moving Average (of the Kaufman Adaptive moving average) - set at 20
3. SuperTrend - I believe this is set at 5 periods and 3*atr but this can be changed
Cloud
the upper band is the highest of the 3 indicators
the lower band is the lowest of the 3 indicators
Entry and Exit:
Enter when the high crosses above the upper band of the cloud.
(This means you will only get a long signal if the high was previously below the upper band of the cloud and then crosses over.)
Exit when the low crosses below the lower band of the cloud .
(This means that this rule will only close if the low was previously above the upper band and then crosses under)
The "Exit" may not trigger if the low (the wick) never gets above the band. In this case the long order will close if the closing price is below the cloud.
Logic
Kaufamn is the best moving average i have found at responding to changes in volatility. This means it moves up or down quickly during expansive moves but becoming very flat during relative choppiness. However, getting flat causes the the Kaufman AMA to trigger a lot of false signals when volatility is transitioning from high to low. This is why the Hull moving average (with its rounded turns) keeps a lot of the false continuations contained because usually prices need to decisively move higher in order to over come the Hull moving average which continues to increase/decrease during the candles after an expansive move.
The super trend places a stagnant floor and ceiling which acts as a great stoploss or trigger as price action attempts to trend in a certain direction. The super trend allows for the user to adjust the likely hood of this cloud indicator changing from bullish to bearish based on the volatility of the asset that is being analyzed.
individually all of these are great. Together the trader can use this cloud to create a trend following or anlysis system that captures the bulk of moves.
Not my best explanation but this indicator is actually pretty simple.
Hope this helps. Happy Trades
-Snarky Puppy
오픈 소스 스크립트
트레이딩뷰의 진정한 정신에 따라, 이 스크립트의 작성자는 이를 오픈소스로 공개하여 트레이더들이 기능을 검토하고 검증할 수 있도록 했습니다. 작성자에게 찬사를 보냅니다! 이 코드는 무료로 사용할 수 있지만, 코드를 재게시하는 경우 하우스 룰이 적용된다는 점을 기억하세요.
면책사항
해당 정보와 게시물은 금융, 투자, 트레이딩 또는 기타 유형의 조언이나 권장 사항으로 간주되지 않으며, 트레이딩뷰에서 제공하거나 보증하는 것이 아닙니다. 자세한 내용은 이용 약관을 참조하세요.
오픈 소스 스크립트
트레이딩뷰의 진정한 정신에 따라, 이 스크립트의 작성자는 이를 오픈소스로 공개하여 트레이더들이 기능을 검토하고 검증할 수 있도록 했습니다. 작성자에게 찬사를 보냅니다! 이 코드는 무료로 사용할 수 있지만, 코드를 재게시하는 경우 하우스 룰이 적용된다는 점을 기억하세요.
면책사항
해당 정보와 게시물은 금융, 투자, 트레이딩 또는 기타 유형의 조언이나 권장 사항으로 간주되지 않으며, 트레이딩뷰에서 제공하거나 보증하는 것이 아닙니다. 자세한 내용은 이용 약관을 참조하세요.