OPEN-SOURCE SCRIPT
K線虛擬幣
// This source code is subject to the terms of the Mozilla Public License 2.0 at mozilla.org/MPL/2.0/
// © dear.simpson
//version=5
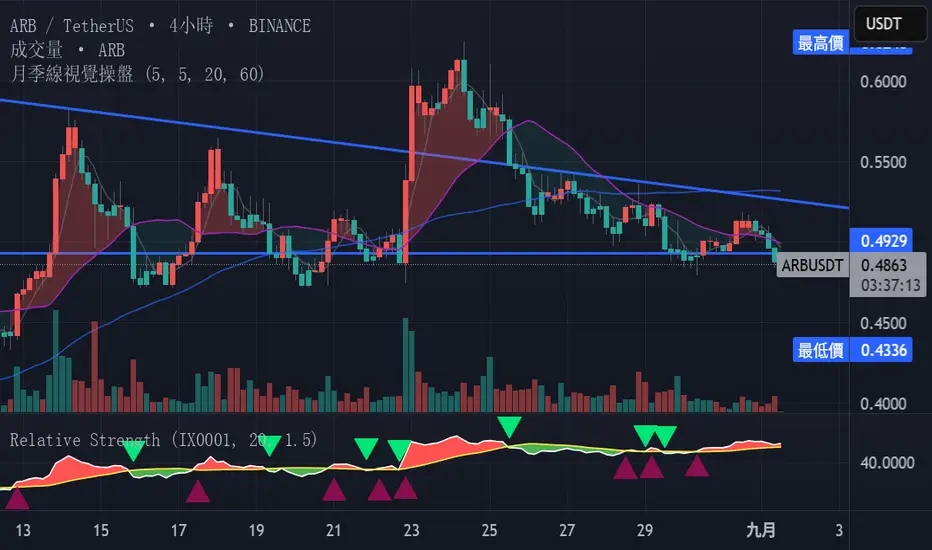
indicator("月季線視覺操盤", "", true)
// Getting inputs
length = input(5, "操盤線週期")
// Calculating
ma = ta.sma(close, length)
spread = close-ma
// Plotcandle
plotcandle(open, high, low, close, title='操盤K線', editable = false , display =display.pane+display.price_scale , color = (spread>=0 ? #ef5350 : #26a69a) , bordercolor= (spread>=0 ? #ef5350 : #26a69a) , wickcolor = #5d606b)
// Getting inputs
maPeriods1 = input( 5 , "MA 1" , group="移動平均線")
maPeriods2 = input(20 , "MA 2" , group="移動平均線")
maPeriods3 = input(60 , "MA 3" , group="移動平均線")
line0 = ta.sma(close, 2)
line1 = ta.sma(close, maPeriods1)
line2 = ta.sma(close, maPeriods2)
line3 = ta.sma(close, maPeriods3)
// Plot Moving Average Line
p0PlotID = plot(line0 ,"MA 0" , color.new(color.black ,100), display = display.none , editable = false)
p1PlotID = plot(line1 ,"MA 1" , color.new(#787b86, 50), display = display.pane+display.price_scale )
p2PlotID = plot(line2 ,"MA 2" , color.new(#787b86, 0), display = display.pane+display.price_scale )
p3PlotID = plot(line3 ,"MA 3" , color.new(color.blue , 30), display = display.pane+display.price_scale )
// Plot Zone Color
fill(p0PlotID, p2PlotID, close > line2 ? color.new(#ef5350, 70) : color.new(#26a69a, 90), '高/低於月線區域顏色')
fill(p0PlotID, p3PlotID, close > line3 ? color.new(#ef5350, 70) : color.new(#26a69a, 90), '高/低於季線區域顏色' , display = display.none )
// © dear.simpson
//version=5
indicator("月季線視覺操盤", "", true)
// Getting inputs
length = input(5, "操盤線週期")
// Calculating
ma = ta.sma(close, length)
spread = close-ma
// Plotcandle
plotcandle(open, high, low, close, title='操盤K線', editable = false , display =display.pane+display.price_scale , color = (spread>=0 ? #ef5350 : #26a69a) , bordercolor= (spread>=0 ? #ef5350 : #26a69a) , wickcolor = #5d606b)
// Getting inputs
maPeriods1 = input( 5 , "MA 1" , group="移動平均線")
maPeriods2 = input(20 , "MA 2" , group="移動平均線")
maPeriods3 = input(60 , "MA 3" , group="移動平均線")
line0 = ta.sma(close, 2)
line1 = ta.sma(close, maPeriods1)
line2 = ta.sma(close, maPeriods2)
line3 = ta.sma(close, maPeriods3)
// Plot Moving Average Line
p0PlotID = plot(line0 ,"MA 0" , color.new(color.black ,100), display = display.none , editable = false)
p1PlotID = plot(line1 ,"MA 1" , color.new(#787b86, 50), display = display.pane+display.price_scale )
p2PlotID = plot(line2 ,"MA 2" , color.new(#787b86, 0), display = display.pane+display.price_scale )
p3PlotID = plot(line3 ,"MA 3" , color.new(color.blue , 30), display = display.pane+display.price_scale )
// Plot Zone Color
fill(p0PlotID, p2PlotID, close > line2 ? color.new(#ef5350, 70) : color.new(#26a69a, 90), '高/低於月線區域顏色')
fill(p0PlotID, p3PlotID, close > line3 ? color.new(#ef5350, 70) : color.new(#26a69a, 90), '高/低於季線區域顏色' , display = display.none )
오픈 소스 스크립트
트레이딩뷰의 진정한 정신에 따라, 이 스크립트의 작성자는 이를 오픈소스로 공개하여 트레이더들이 기능을 검토하고 검증할 수 있도록 했습니다. 작성자에게 찬사를 보냅니다! 이 코드는 무료로 사용할 수 있지만, 코드를 재게시하는 경우 하우스 룰이 적용된다는 점을 기억하세요.
면책사항
해당 정보와 게시물은 금융, 투자, 트레이딩 또는 기타 유형의 조언이나 권장 사항으로 간주되지 않으며, 트레이딩뷰에서 제공하거나 보증하는 것이 아닙니다. 자세한 내용은 이용 약관을 참조하세요.
오픈 소스 스크립트
트레이딩뷰의 진정한 정신에 따라, 이 스크립트의 작성자는 이를 오픈소스로 공개하여 트레이더들이 기능을 검토하고 검증할 수 있도록 했습니다. 작성자에게 찬사를 보냅니다! 이 코드는 무료로 사용할 수 있지만, 코드를 재게시하는 경우 하우스 룰이 적용된다는 점을 기억하세요.
면책사항
해당 정보와 게시물은 금융, 투자, 트레이딩 또는 기타 유형의 조언이나 권장 사항으로 간주되지 않으며, 트레이딩뷰에서 제공하거나 보증하는 것이 아닙니다. 자세한 내용은 이용 약관을 참조하세요.