OPEN-SOURCE SCRIPT
업데이트됨 Master Simple Indicator
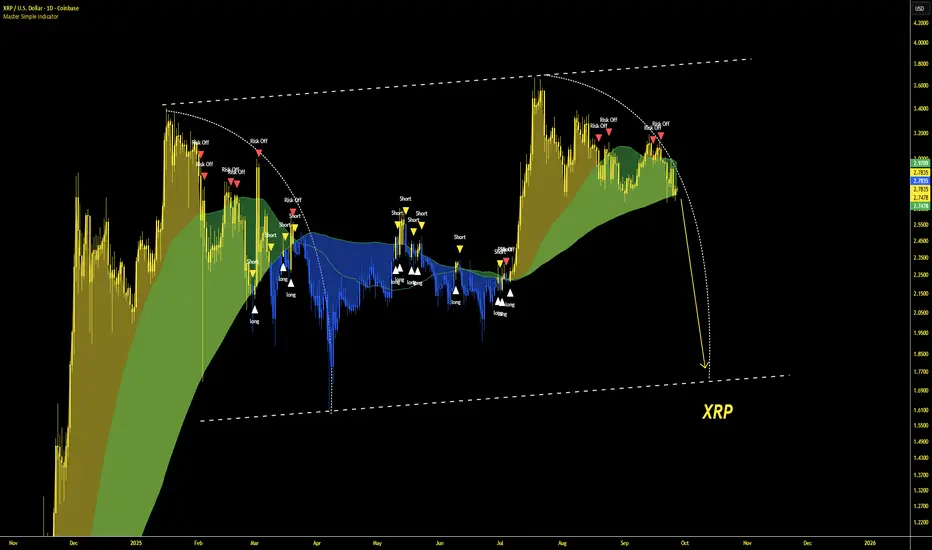
The streamlined Pine Script, created by masterbtcltc, is a technical analysis indicator that overlays on a price chart to provide buy and sell signals based on a dynamic 120-day simple moving average (SMA). Here's how it works:
Dynamic Moving Average: Calculates a 120-day SMA (ma_dynamic) using closing prices to smooth out price fluctuations and identify trends.
Buy/Sell Signals:
Buy Signal: Triggered when the closing price crosses above the 120-day SMA (longSignal), indicating potential bullish momentum. A white triangle with "close" text appears below the bar.
Sell Signal: Triggered when the closing price crosses below the 120-day SMA (shortSignal), suggesting bearish momentum. A yellow triangle with "Short" text appears above the bar.
Alerts: Generates alerts for buy (Long Signal Alert) and sell (Short Signal Alert) signals, notifying users when the price crosses the SMA.
Visual Highlights:
Price vs. SMA: The area between the closing price and the 120-day SMA is filled with yellow if the price is above the SMA (bullish) or blue if below (bearish).
50-day vs. 120-day SMA: The area between the 50-day SMA and 120-day SMA is filled green when the 50-day SMA is above the 120-day SMA, indicating a stronger bullish trend.
Created by masterbtcltc, this indicator helps traders identify trend changes and potential entry/exit points based on price interactions with the 120-day SMA, with clear visual cues and alerts for decision-making.
릴리즈 노트
text change릴리즈 노트
added risk off and candle color changes so hide the main asset오픈 소스 스크립트
트레이딩뷰의 진정한 정신에 따라, 이 스크립트의 작성자는 이를 오픈소스로 공개하여 트레이더들이 기능을 검토하고 검증할 수 있도록 했습니다. 작성자에게 찬사를 보냅니다! 이 코드는 무료로 사용할 수 있지만, 코드를 재게시하는 경우 하우스 룰이 적용된다는 점을 기억하세요.
면책사항
해당 정보와 게시물은 금융, 투자, 트레이딩 또는 기타 유형의 조언이나 권장 사항으로 간주되지 않으며, 트레이딩뷰에서 제공하거나 보증하는 것이 아닙니다. 자세한 내용은 이용 약관을 참조하세요.
오픈 소스 스크립트
트레이딩뷰의 진정한 정신에 따라, 이 스크립트의 작성자는 이를 오픈소스로 공개하여 트레이더들이 기능을 검토하고 검증할 수 있도록 했습니다. 작성자에게 찬사를 보냅니다! 이 코드는 무료로 사용할 수 있지만, 코드를 재게시하는 경우 하우스 룰이 적용된다는 점을 기억하세요.
면책사항
해당 정보와 게시물은 금융, 투자, 트레이딩 또는 기타 유형의 조언이나 권장 사항으로 간주되지 않으며, 트레이딩뷰에서 제공하거나 보증하는 것이 아닙니다. 자세한 내용은 이용 약관을 참조하세요.