OPEN-SOURCE SCRIPT
업데이트됨 KINSKI RSI Short/Long

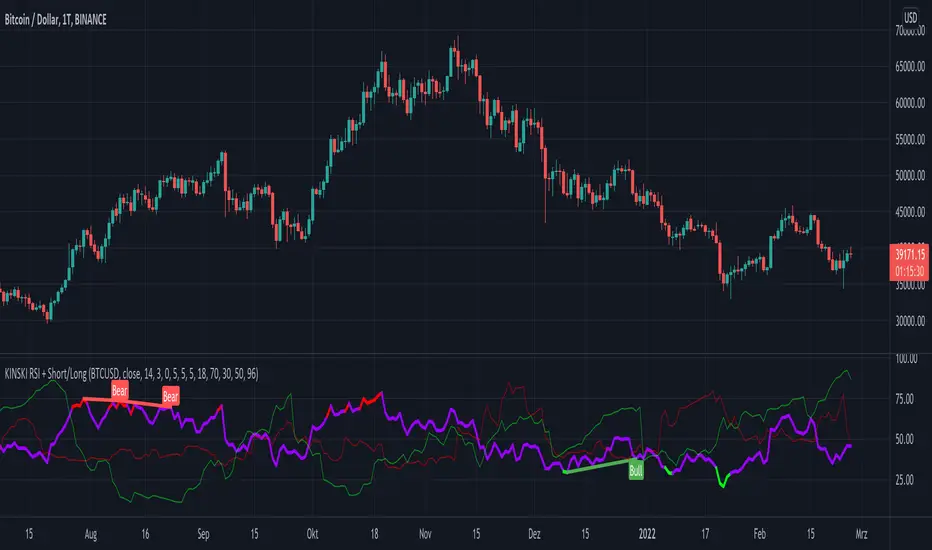
Extends the display of the Relative Strength Index (RSI) by shorts and longs from Bitmex and shows them as a diagram.
How to interpret the display?
- blue line is the default Relative Strength Index
- red line means "oversold
- green line "overbought"
- grey dotted line up/down indicates the optimal range for up and down movements 30 to 70
- in general, the reaching or crossing of the thresholds in the direction of the mid-range is seen as a possible buy or sell signal
- RSI values (blue line) of over 70 percent are considered "overbought", values below 30 percent "oversold
Which settings can be made?
- Selection for the "Currency". Default value is "BTCUSD". Currently only the following currencies are supported "BTCUSD", "ETHUSD", "ETCUSD", "OMGUSD", "XLMUSD", "XTZUSD".
- Selection for calculation formula ("Calculation"). The default value is "hlc3".
- Field for the moving average value ("RSI Length"). The default value is 14, but values of 7, 9 or 25 are also common. The shorter the period under consideration, the more volatile the indicator is, but with longer periods, fewer signals are triggered.
- furthermore you can make layout adjustments via the "Style" menu
릴리즈 노트
- extend the supported currencies: "BTCUSD", "ETHUSD", "ETCUSD", "EOSUSD", "IOTUSD", "LTCUSD", "OMGUSD", "XRPUSD", "XMRUSD", "XLMUSD", "XTZUSD", "ZECUSD"
- changed the styling for Overbought and Oversold lines
Hint
the description text for red and green line is wrong. here now the correct description:
- red line indicates the number of SHORTS. Line up/down means many/less.
- green line indicates the number of LONGS. Line up/down means many/less.
릴리즈 노트
- Display optimized for RSI line. Overbought zone (shows a possible sell-signal) is shown in red. Oversold zone (shows a possible buy signal) is displayed in green.
릴리즈 노트
- removed no more needed Option "Up/Down Movements: On/Off"
릴리즈 노트
- PineScript 4 compatibility increased. Deprecated attribute "transp" replaced by function color.new()릴리즈 노트
- Convert to PineScript5
- add optional Divergence Identification (enabled by default)
릴리즈 노트
- Code optimization: define type "color"
오픈 소스 스크립트
트레이딩뷰의 진정한 정신에 따라, 이 스크립트의 작성자는 이를 오픈소스로 공개하여 트레이더들이 기능을 검토하고 검증할 수 있도록 했습니다. 작성자에게 찬사를 보냅니다! 이 코드는 무료로 사용할 수 있지만, 코드를 재게시하는 경우 하우스 룰이 적용된다는 점을 기억하세요.
My published Scripts:
de.tradingview.com/u/KINSKI/
Appreciation of my work: paypal.com/paypalme/steffenhollstein
de.tradingview.com/u/KINSKI/
Appreciation of my work: paypal.com/paypalme/steffenhollstein
면책사항
해당 정보와 게시물은 금융, 투자, 트레이딩 또는 기타 유형의 조언이나 권장 사항으로 간주되지 않으며, 트레이딩뷰에서 제공하거나 보증하는 것이 아닙니다. 자세한 내용은 이용 약관을 참조하세요.