OPEN-SOURCE SCRIPT
DDDDD: ATR & ADR Table + Suggested Time-based Exit
📈 DDDDD: ATR & ADR Table + Suggested Time-based Exit
This indicator provides a simple yet powerful table displaying key volatility metrics for any timeframe you apply it to. It is designed for traders who want to assess the volatility of an asset, estimate the average time required for a potential move, and define a time-based exit strategy.
🔍 Features:
Displays ATR (Average True Range) for the selected length
Shows Average Range (High-Low) and Maximum Range over a configurable number of bars
Calculates Avg Bars/Move → average number of bars needed to achieve the maximum range
Calculates Recommended Exit Bars → suggested maximum holding period (in bars) before considering an exit if price hasn’t moved as expected
All values dynamically adjust based on the chart’s current timeframe
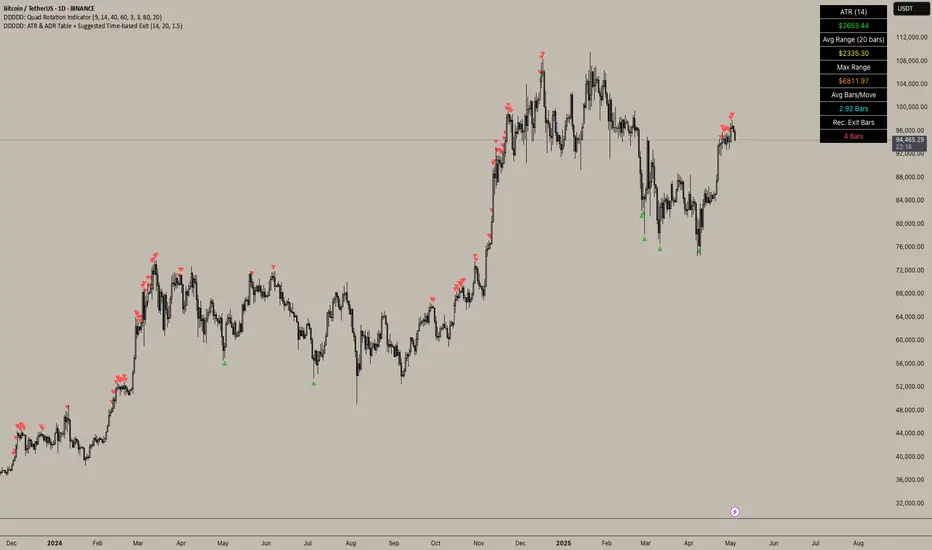
Outputs values directly in a table overlay on your main chart for quick reference
📝 How to interpret the table:
Field Meaning
ATR (14) Average True Range over the last 14 bars (volatility indicator)
Avg Range (20) Average High-Low range over the last 20 bars
Max Range Maximum High-Low range observed in the last 20 bars
Avg Bars/Move Average number of bars it takes to achieve a Max Range move
Rec. Exit Bars Suggested max holding period (bars) → consider exit if move hasn’t occurred
✅ How to use:
Apply this indicator to any chart (works on minutes, hourly, daily, weekly…)
It will automatically calculate based on the chart’s current timeframe
Use ATR & Avg Range to gauge volatility
Use Avg Bars/Move to estimate how long the market usually takes to achieve a big move
Use Rec. Exit Bars as a soft stop — if price hasn’t moved by this time, consider exiting due to declining probability of a breakout
⚠️ Notes:
All values are relative to your current chart timeframe. For example:
→ On a daily chart, ATR represents daily volatility
→ On a 1H chart, ATR represents hourly volatility
“Bars” refers to the bars of the current timeframe. Always interpret time accordingly.
Perfect for traders who want to:
Time their trades based on average volatility
Avoid overholding losing positions
Set time-based exit rules to complement price-based stoplosses
This indicator provides a simple yet powerful table displaying key volatility metrics for any timeframe you apply it to. It is designed for traders who want to assess the volatility of an asset, estimate the average time required for a potential move, and define a time-based exit strategy.
🔍 Features:
Displays ATR (Average True Range) for the selected length
Shows Average Range (High-Low) and Maximum Range over a configurable number of bars
Calculates Avg Bars/Move → average number of bars needed to achieve the maximum range
Calculates Recommended Exit Bars → suggested maximum holding period (in bars) before considering an exit if price hasn’t moved as expected
All values dynamically adjust based on the chart’s current timeframe
Outputs values directly in a table overlay on your main chart for quick reference
📝 How to interpret the table:
Field Meaning
ATR (14) Average True Range over the last 14 bars (volatility indicator)
Avg Range (20) Average High-Low range over the last 20 bars
Max Range Maximum High-Low range observed in the last 20 bars
Avg Bars/Move Average number of bars it takes to achieve a Max Range move
Rec. Exit Bars Suggested max holding period (bars) → consider exit if move hasn’t occurred
✅ How to use:
Apply this indicator to any chart (works on minutes, hourly, daily, weekly…)
It will automatically calculate based on the chart’s current timeframe
Use ATR & Avg Range to gauge volatility
Use Avg Bars/Move to estimate how long the market usually takes to achieve a big move
Use Rec. Exit Bars as a soft stop — if price hasn’t moved by this time, consider exiting due to declining probability of a breakout
⚠️ Notes:
All values are relative to your current chart timeframe. For example:
→ On a daily chart, ATR represents daily volatility
→ On a 1H chart, ATR represents hourly volatility
“Bars” refers to the bars of the current timeframe. Always interpret time accordingly.
Perfect for traders who want to:
Time their trades based on average volatility
Avoid overholding losing positions
Set time-based exit rules to complement price-based stoplosses
오픈 소스 스크립트
트레이딩뷰의 진정한 정신에 따라, 이 스크립트의 작성자는 이를 오픈소스로 공개하여 트레이더들이 기능을 검토하고 검증할 수 있도록 했습니다. 작성자에게 찬사를 보냅니다! 이 코드는 무료로 사용할 수 있지만, 코드를 재게시하는 경우 하우스 룰이 적용된다는 점을 기억하세요.
면책사항
해당 정보와 게시물은 금융, 투자, 트레이딩 또는 기타 유형의 조언이나 권장 사항으로 간주되지 않으며, 트레이딩뷰에서 제공하거나 보증하는 것이 아닙니다. 자세한 내용은 이용 약관을 참조하세요.
오픈 소스 스크립트
트레이딩뷰의 진정한 정신에 따라, 이 스크립트의 작성자는 이를 오픈소스로 공개하여 트레이더들이 기능을 검토하고 검증할 수 있도록 했습니다. 작성자에게 찬사를 보냅니다! 이 코드는 무료로 사용할 수 있지만, 코드를 재게시하는 경우 하우스 룰이 적용된다는 점을 기억하세요.
면책사항
해당 정보와 게시물은 금융, 투자, 트레이딩 또는 기타 유형의 조언이나 권장 사항으로 간주되지 않으며, 트레이딩뷰에서 제공하거나 보증하는 것이 아닙니다. 자세한 내용은 이용 약관을 참조하세요.