OPEN-SOURCE SCRIPT
ProRSI
ProRSI is another in indicator to add to the Pro Indicator suite by DynaProTrading. This algo is made up of a few key components referenced below.
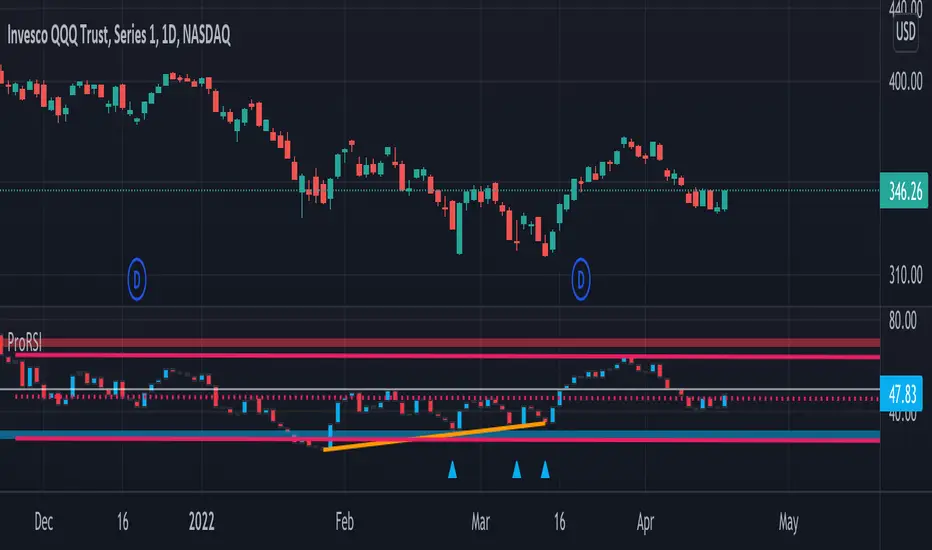
RSI: The primary function of the algo is to plot the candles of the ticker of choice on an oscillator pane to show how price compared to the various key levels. As you can see the red and blue arrows indicator oversold and overbought levels in conjunction with price.
Divergences: In addition to the RSI alerts, there is also a divergence functions where price could be making a higher high but the RSI indicator is making a lower high which is indicating a divergence in price. This is displayed by the lines in the lower window pane from one peak to another.
Trend Lines: Trend lines exist in all technical analysis but in this indicator, it shows the trend lines of the candles in the RSI pane which can help find support and resistance just like with normal price action.
Regression Model: The last key component of the indicator is a regression model which acts as a trend channel for more recent price action.
오픈 소스 스크립트
트레이딩뷰의 진정한 정신에 따라, 이 스크립트의 작성자는 이를 오픈소스로 공개하여 트레이더들이 기능을 검토하고 검증할 수 있도록 했습니다. 작성자에게 찬사를 보냅니다! 이 코드는 무료로 사용할 수 있지만, 코드를 재게시하는 경우 하우스 룰이 적용된다는 점을 기억하세요.
면책사항
해당 정보와 게시물은 금융, 투자, 트레이딩 또는 기타 유형의 조언이나 권장 사항으로 간주되지 않으며, 트레이딩뷰에서 제공하거나 보증하는 것이 아닙니다. 자세한 내용은 이용 약관을 참조하세요.
오픈 소스 스크립트
트레이딩뷰의 진정한 정신에 따라, 이 스크립트의 작성자는 이를 오픈소스로 공개하여 트레이더들이 기능을 검토하고 검증할 수 있도록 했습니다. 작성자에게 찬사를 보냅니다! 이 코드는 무료로 사용할 수 있지만, 코드를 재게시하는 경우 하우스 룰이 적용된다는 점을 기억하세요.
면책사항
해당 정보와 게시물은 금융, 투자, 트레이딩 또는 기타 유형의 조언이나 권장 사항으로 간주되지 않으며, 트레이딩뷰에서 제공하거나 보증하는 것이 아닙니다. 자세한 내용은 이용 약관을 참조하세요.