OPEN-SOURCE SCRIPT
업데이트됨 6F Signals (With Labels)
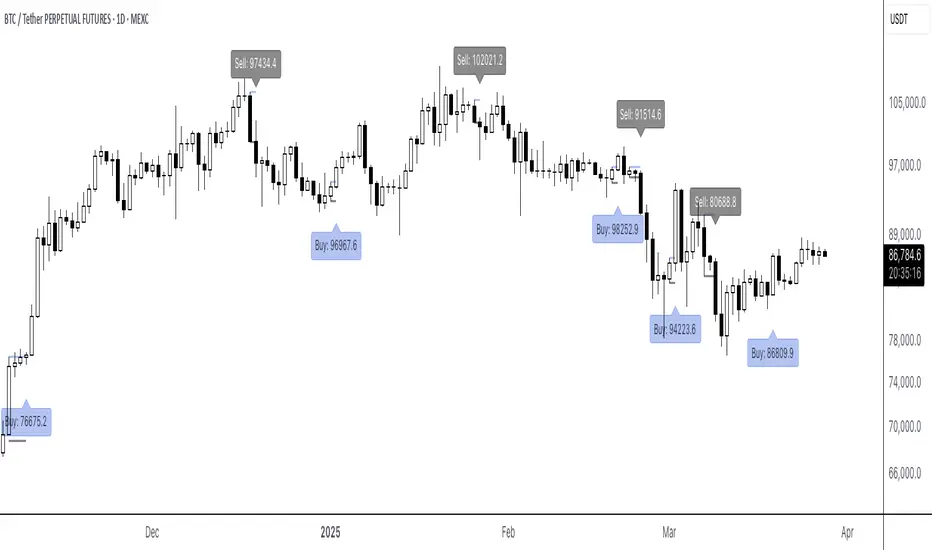
6F Signals (With Labels)
This TradingView indicator plots potential buy and sell signals.
Signals
- Buy signals: "Buy: [price]" labels appear below the bar.
- Sell signals: "Sell: [price]" labels appear above the bar.
Perfect for traders looking for straightforward, labeled entry and exit points directly on their price chart!
릴리즈 노트
"6F Signals (With Labels) - Alternating" is a powerful Pine Script (version 5) indicator designed for TradingView, overlaying directly on your price chart to deliver clear buy and sell signals based on Heikin Ashi (HA) candlestick patterns. This indicator leverages HA’s smoothing capabilities to identify trend reversals and generate alternating signals, making it an intuitive tool for traders seeking precise entry and exit points.Key Features
Heikin Ashi Integration: Calculates HA values (open, high, low, close) from raw OHLC data to reduce market noise and highlight trends more effectively than traditional candlesticks.
C Candle Detection: Identifies "C Candles" at trend reversal points (bullish to bearish or vice versa), using these as key reference levels for signal generation.
Alternating Signals: Generates buy signals when the HA close crosses above a C Candle’s high and sell signals when it crosses below a C Candle’s low, ensuring only the first signal per trend change is triggered to avoid repetition.
Visual Elements:
Lines: Plots solid blue lines (default) from a C Candle’s high to the buy signal bar and solid red lines (default) from a C Candle’s low to the sell signal bar, both with a 2-pixel width for clarity.
Labels: Displays green "Buy: [price]" labels below the signal bar for buy signals and red "Sell: [price]" labels above the signal bar for sell signals, showing the exact closing price.
Customization: Allows users to adjust the high line color (default blue) and low line color (default red) via input settings, tailoring the visuals to personal chart preferences.
How It Works
Trend Detection: Uses Heikin Ashi close and open prices to determine bullish (close > open) or bearish (close < open) trends.
C Candle Identification: Marks a C Candle when a trend reversal occurs, storing its high and low prices and bar index.
Signal Logic: Triggers a buy signal when the HA close exceeds the C Candle high or a sell signal when it falls below the C Candle low, but only after the C Candle bar and if no prior signal has been triggered for that reversal. Signals alternate to maintain clarity (e.g., a buy follows a sell, not another buy).
Visualization: Draws horizontal lines from the C Candle to the signal bar and adds labels at the signal point, making it easy to spot trading opportunities.
Visual Description
On your chart, you’ll see:
Candlesticks overlaid with blue and red horizontal lines connecting C Candles to signal bars.
Green "Buy: [price]" labels below bullish candles where buy signals occur (e.g., "Buy: 98305").
Red "Sell: [price]" labels above bearish candles where sell signals occur (e.g., "Sell: 91552.88").
Lines are solid, stopping at the signal bar, ensuring a clean and focused display.
Ideal For
Trend Traders: Perfect for those following reversals or momentum shifts using Heikin Ashi.
Visual Learners: Suits traders who prefer clear, labeled signals over complex calculations.
Customizers: Offers flexibility with adjustable line colors to match any chart theme.
Customization Options
High Line Color: Default blue, adjustable in settings.
Low Line Color: Default red, adjustable in settings.
Why Use It?
"6F Signals (With Labels) - Alternating" simplifies trend reversal trading by combining Heikin Ashi’s noise reduction with precise, alternating signals. Its visual clarity—through colored lines and labeled prices—helps traders act confidently without second-guessing. Test it on your charts to enhance your strategy with a straightforward, effective tool tailored for TradingView!
릴리즈 노트
The 6F Signals (With Labels) - Alternating indicator is a versatile and visually intuitive tool designed to help traders identify potential buy and sell opportunities using Heikin Ashi (HA) trend analysis. By smoothing price action and detecting key reversal points, this indicator generates actionable signals overlaid directly on your chart, making it ideal for swing traders and trend followers.Key Features:
Heikin Ashi-Based Analysis: Calculates its own HA values from raw OHLC data to smooth price fluctuations and enhance trend detection, independent of your chart’s display settings.
C Candle Detection: Identifies "C Candles" at points where the HA trend reverses (e.g., from bullish to bearish or vice versa), marking potential support and resistance zones.
Breakout Signals:
Buy Signal: Triggered when the HA close crosses above the high of the most recent C Candle, suggesting a potential upward breakout.
Sell Signal: Triggered when the HA close crosses below the low of the most recent C Candle, indicating a potential downward breakout.
Alternating Logic: Ensures signals alternate between buy and sell, allowing only one signal per C Candle to capture market swings and prevent consecutive signals of the same type.
Visual Indicators:
Horizontal Lines: Teal lines (high) and maroon lines (low) connect the C Candle’s high and low levels to the signal bar, highlighting key price levels.
Labels: Clear "Buy: [price]" and "Sell: [price]" labels appear at signal points, displaying the raw closing price for precise entry/exit reference.
Customizable Colors: Adjust the high and low line colors via input settings to match your chart preferences.
How It Works:
Trend Reversal Detection: The indicator uses HA calculations to detect trend changes, labeling these points as C Candles based on shifts in bullish (HA close > HA open) or bearish (HA close < HA open) conditions.
Signal Generation:
A buy signal occurs when the HA close breaks above the C Candle’s high.
A sell signal occurs when the HA close breaks below the C Candle’s low.
Signal Control: Only one signal is allowed per C Candle, and signals must alternate (e.g., a buy cannot follow another buy), ensuring a balanced trading approach.
Visualization:
Solid teal lines (width 2) extend from the C Candle’s high to the buy/sell signal bar.
Solid maroon lines (width 2) extend from the C Candle’s low to the signal bar.
Labels are placed below bars for buys (teal, semi-transparent) and above bars for sells (gray, semi-transparent), showing the raw close price.
Usage Tips:
Chart Compatibility: Works on any chart type (regular candlesticks or Heikin Ashi) since it calculates HA values internally from raw OHLC data.
Confirmation: Combine with other indicators (e.g., moving averages, volume) or price action analysis to validate signals and refine your trading strategy.
Customization: Modify the teal (high) and maroon (low) line colors in the settings to suit your visual preferences or chart theme.
Timeframes: Effective on various timeframes, though it shines in swing trading setups on daily or higher charts (e.g., 1D, as seen in BTC/USD examples).
Notes:
Price Display: Labels show the actual (raw) closing price at the signal bar, not the HA close, providing real-world entry/exit levels.
Signal Clarity: Cyan dots mark buy signals, and red dots mark sell signals on some chart setups, enhancing visibility alongside the labels and lines.
This indicator offers a systematic way to spot trend-driven opportunities, leveraging Heikin Ashi’s smoothing effect to reduce noise and focus on significant price movements. Whether you’re trading cryptocurrencies like BTC/USD or other assets, the 6F Signals indicator provides clear, actionable insights with a professional and user-friendly design.
릴리즈 노트
The 6F Signals indicator uses Heikin Ashi candles to identify high-probability buy and sell signals on your chart, perfect for traders of stocks, forex, or cryptocurrencies like Bitcoin. It displays solid teal and maroon lines to mark the high and low of key "C Candles" (trend change points), along with dynamic dashed lines that act as trailing stop-loss levels—teal lines rise for buy signals, and maroon lines fall for sell signals. Optional labels show the exact price of each signal, and you can toggle small triangles to visually highlight buy and sell opportunities. Ideal for spotting trend reversals and managing risk with automatic stop-loss adjustments.Features:
Buy/Sell Signals: Automatically detects buy signals (blue labels) when the price crosses above the C High, and sell signals (gray labels) when it crosses below the C Low, based on Heikin Ashi calculations.
Trailing Stops: Dashed teal lines step up for buy signals (using Heikin Ashi lows), and dashed maroon lines step down for sell signals (using Heikin Ashi highs), helping you track dynamic stop-loss levels.
Customizable: Adjust the colors of the high and low lines, and toggle labels or arrows for signals via the input settings.
Overlay: Works directly on your price chart, making it easy to see signals alongside price action.
How to Use:
Add the indicator to your chart (e.g., Bitcoin/USD, 1-day timeframe).
Look for blue "Buy" labels or triangles below the price for long opportunities, and gray "Sell" labels or triangles above the price for short opportunities.
Use the trailing stop lines (teal for buys, maroon for sells) to manage your risk and adjust your stop-loss as the price moves.
Customize the colors or toggle labels/arrows in the settings to suit your trading style.
Note: This indicator is designed for educational and informational purposes. Always test it on a demo account before using it in live trading.
릴리즈 노트
Let’s break down “6F Signals” How It Works: The Nitty-Gritty
The script starts by smoothing out price noise, making trends easier to spot than with regular candlesticks. It checks if the HA close is above or below the HA open to determine if the trend’s bullish (upward) or bearish (downward).
C Candle Detection: This is where the magic happens. The indicator hunts for “C Candles”—key reversal points where the HA trend flips, like from bullish to bearish or vice versa. When it spots one, it locks in the high and low prices of that candle, along with the bar index, as reference levels for signals. These C Candles act like critical support and resistance zones.
Signal Generation: Here’s the play-by-play for the signals:
Buy Signal: A buy signal fires when the HA close breaks above the high of the most recent C Candle. This suggests a potential upward breakout or trend reversal.
Sell Signal: A sell signal triggers when the HA close drops below the low of the most recent C Candle, indicating a possible downward breakout or reversal.
Alternating Logic: The script’s smart—it only allows one signal (buy or sell) per C Candle and ensures signals alternate. So, you won’t get back-to-back buy signals or sell signals, keeping things clean and preventing confusion.
Signal Control & Timing: The indicator tracks whether a signal’s already been triggered for a given C Candle. It won’t fire another signal until a new C Candle forms and the conditions are met. It also checks the bar index to ensure signals only happen after the C Candle bar, keeping everything timed right.
Visualization on Your Chart:
Lines: It draws solid lines from the C Candle’s high and low to the bar where the signal occurs. By default, high lines are blue (or customizable), and low lines are gray (also customizable), with a clean 2-pixel width. These lines stop at the signal bar, giving you a clear visual of the price levels driving the signal.
Labels: When a signal hits, you’ll see green “Buy: [price]” labels below the bar for buys and gray “Sell: [price]” labels above the bar for sells. These show the raw closing price at the signal bar—not the HA close—so you get real-world entry/exit levels.
Optional Arrows: You can toggle small triangles—blue for buys (below the bar) and gray for sells (above the bar)—to visually pop those signals if you want extra flair.
Customization & Flexibility: You’re in control, bro. The script lets you tweak the high and low line colors (default blue for buys, gray for sells) via input settings, plus toggle on or off labels, arrows, and even additional data like high/low prices in the labels. It’s built for any chart type (regular candlesticks or HA) since it calculates HA internally, so it’s versatile AF.
Why It’s Fire for Traders
This indicator’s perfect for swing traders or day traders chasing trends in volatile markets, like crypto (think BTC/USD) or forex. It uses HA’s noise-reducing power to focus on big moves, and the alternating signal logic keeps you from getting overwhelmed. The visual cues—lines, labels, and optional arrows—make it easy to spot opportunities, whether you’re on a 1D chart or shorter timeframes. Pair it with other tools like moving averages or volume for confirmation, and you’ve got a solid setup to ride those market waves.
Notes to Keep It Real
The prices in the labels are the raw close, not HA values, so you’re getting actionable levels for trading.
It’s educational and informational—always test it on a demo account before going live, yeah?
Works across assets, but it really shines on charts with clear trends, like swing setups on daily or higher timeframes.
So, there you have it—smooth, detailed, and ready to help you dominate your charts. This “6F Signals” script isn’t just a tool; it’s your trading co-pilot, keeping it clean, sharp, and totally customizable for your style. Let’s crush it!
릴리즈 노트
Overview"6F Signals (With Labels) - Alternating" is a powerful Pine Script (v5) indicator for TradingView, designed to help traders identify high-probability buy and sell opportunities using Heikin Ashi (HA) trend analysis. By smoothing price action and detecting key reversal points, this indicator overlays clear, alternating signals directly on your chart—perfect for swing traders, trend followers, and visual learners.
Key Features
Heikin Ashi Smoothing: Calculates HA values (open, high, low, close) from raw OHLC data to reduce market noise and enhance trend detection, independent of your chart type.
C Candle Detection: Identifies "C Candles" at trend reversal points (bullish to bearish or vice versa), marking potential support and resistance zones.
Alternating Breakout Signals:
Buy Signal: Triggers when the HA close crosses above the C Candle’s high, suggesting an upward breakout.
Sell Signal: Triggers when the HA close crosses below the C Candle’s low, indicating a downward breakout.
Signals alternate (e.g., a buy follows a sell) to avoid repetition and maintain clarity.
Visual Elements:
Lines: Solid teal lines (high) and maroon lines (low) connect the C Candle’s levels to the signal bar, with a 2-pixel width for visibility.
Labels: Green "Buy: [price]" labels appear below buy signal bars, and red "Sell: [price]" labels appear above sell signal bars, showing the raw closing price.
Optional Arrows: Toggle small triangles (blue for buys, gray for sells) to highlight signals.
Customization: Adjust high and low line colors (default teal and maroon) and toggle labels or arrows via input settings to match your chart preferences.
How It Works
Trend Detection: Uses HA close and open prices to identify bullish (close > open) or bearish (close < open) trends.
C Candle Identification: Marks a C Candle at trend reversals, storing its high, low, and bar index.
Signal Logic: Triggers a buy when the HA close exceeds the C Candle high, or a sell when it falls below the C Candle low. Signals only fire after the C Candle bar and alternate to keep the chart clean.
Visualization: Draws horizontal lines from the C Candle to the signal bar and adds labels (and optional arrows) at the signal point for easy identification.
Visual Description
Candlesticks: Overlaid with teal (high) and maroon (low) lines connecting C Candles to signal bars.
Labels: Green "Buy: [price]" below bullish candles (e.g., "Buy: 98305") and red "Sell: [price]" above bearish candles (e.g., "Sell: 91552.88").
Lines: Solid, stopping at the signal bar for a clean display.
Usage Tips
Chart Compatibility: Works on any chart type (regular candlesticks or Heikin Ashi) since it calculates HA values internally.
Confirmation: Pair with other indicators (e.g., moving averages, volume) or price action analysis to validate signals.
Timeframes: Shines in swing trading on daily or higher charts (e.g., 1D for BTC/USD), but effective across various timeframes.
Customization: Modify line colors or toggle labels/arrows in the settings to suit your style.
Why Use It?
This indicator simplifies trend reversal trading by combining Heikin Ashi’s noise reduction with precise, alternating signals. Its visual clarity—through colored lines, labeled prices, and optional arrows—helps traders act confidently. Whether you’re trading cryptocurrencies like BTC/USD, stocks, or forex, "6F Signals" offers a straightforward, effective tool to enhance your strategy.
Notes
Price Display: Labels show the raw closing price at the signal bar (not HA close) for real-world entry/exit levels.
Signal Clarity: Optional cyan dots (buy) and red dots (sell) can enhance visibility on some setups.
Disclaimer: For educational purposes. Always test on a demo account before live trading.
오픈 소스 스크립트
트레이딩뷰의 진정한 정신에 따라, 이 스크립트의 작성자는 이를 오픈소스로 공개하여 트레이더들이 기능을 검토하고 검증할 수 있도록 했습니다. 작성자에게 찬사를 보냅니다! 이 코드는 무료로 사용할 수 있지만, 코드를 재게시하는 경우 하우스 룰이 적용된다는 점을 기억하세요.
면책사항
해당 정보와 게시물은 금융, 투자, 트레이딩 또는 기타 유형의 조언이나 권장 사항으로 간주되지 않으며, 트레이딩뷰에서 제공하거나 보증하는 것이 아닙니다. 자세한 내용은 이용 약관을 참조하세요.
오픈 소스 스크립트
트레이딩뷰의 진정한 정신에 따라, 이 스크립트의 작성자는 이를 오픈소스로 공개하여 트레이더들이 기능을 검토하고 검증할 수 있도록 했습니다. 작성자에게 찬사를 보냅니다! 이 코드는 무료로 사용할 수 있지만, 코드를 재게시하는 경우 하우스 룰이 적용된다는 점을 기억하세요.
면책사항
해당 정보와 게시물은 금융, 투자, 트레이딩 또는 기타 유형의 조언이나 권장 사항으로 간주되지 않으며, 트레이딩뷰에서 제공하거나 보증하는 것이 아닙니다. 자세한 내용은 이용 약관을 참조하세요.