OPEN-SOURCE SCRIPT
업데이트됨 Good Signal Indicator
Description:
The Good Signal Indicator utilizes Exponential Moving Averages (EMA) across multiple timeframes to provide buy or sell signals based on the relative positioning of short-term and long-term EMAs.
Features:
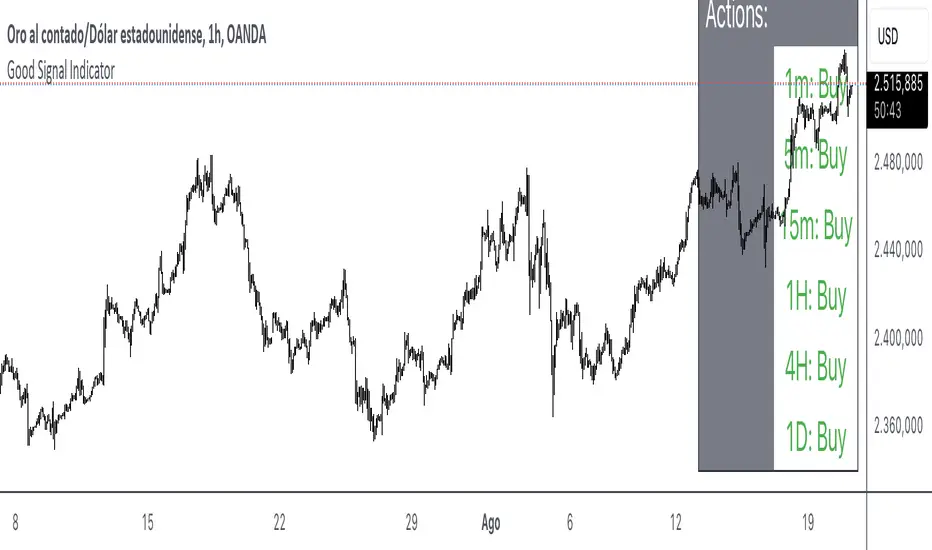
Multiple Timeframes: Includes EMAs for 1 minute, 5 minutes, 15 minutes, 1 hour, 4 hours, and 1 day.
Customizable Settings: Allows for the configuration of EMA lengths (20 and 50 periods).
Clear Signals: Displays buy, sell, or neutral signals on a table for each timeframe.
How It Works:
EMA Calculation: Computes the EMA values for specified lengths and timeframes.
Signal Generation: Determines buy and sell signals based on whether the current EMA is above or below the EMA from 30 bars ago.
Table Display: Presents the signals in a table at the bottom-right of the chart, showing whether to buy, sell, or hold for each timeframe.
Usage Instructions:
Apply the Indicator: Add the script to your TradingView chart.
Review Signals: Observe the table to understand the current trend for each timeframe.
Adjust Settings: Customize the EMA lengths if needed to fit your trading strategy.
Example Chart:
Ensure your chart is clean, showing only the indicator table without additional clutter. The table should clearly reflect the current buy, sell, or neutral status based on the EMA calculations.
Disclaimer: This indicator is a tool for analysis and should be used in conjunction with other indicators and market research. Always test with historical data before applying it to live trading.
The Good Signal Indicator utilizes Exponential Moving Averages (EMA) across multiple timeframes to provide buy or sell signals based on the relative positioning of short-term and long-term EMAs.
Features:
Multiple Timeframes: Includes EMAs for 1 minute, 5 minutes, 15 minutes, 1 hour, 4 hours, and 1 day.
Customizable Settings: Allows for the configuration of EMA lengths (20 and 50 periods).
Clear Signals: Displays buy, sell, or neutral signals on a table for each timeframe.
How It Works:
EMA Calculation: Computes the EMA values for specified lengths and timeframes.
Signal Generation: Determines buy and sell signals based on whether the current EMA is above or below the EMA from 30 bars ago.
Table Display: Presents the signals in a table at the bottom-right of the chart, showing whether to buy, sell, or hold for each timeframe.
Usage Instructions:
Apply the Indicator: Add the script to your TradingView chart.
Review Signals: Observe the table to understand the current trend for each timeframe.
Adjust Settings: Customize the EMA lengths if needed to fit your trading strategy.
Example Chart:
Ensure your chart is clean, showing only the indicator table without additional clutter. The table should clearly reflect the current buy, sell, or neutral status based on the EMA calculations.
Disclaimer: This indicator is a tool for analysis and should be used in conjunction with other indicators and market research. Always test with historical data before applying it to live trading.
릴리즈 노트
Description:The Good Signal Indicator utilizes Exponential Moving Averages (EMA) across multiple timeframes to provide buy or sell signals based on the relative positioning of short-term and long-term EMAs.
Features:
Multiple Timeframes: Includes EMAs for 1 minute, 5 minutes, 15 minutes, 1 hour, 4 hours, and 1 day.
Customizable Settings: Allows for the configuration of EMA lengths (20 and 50 periods).
Clear Signals: Displays buy, sell, or neutral signals on a table for each timeframe.
How It Works:
EMA Calculation: Computes the EMA values for specified lengths and timeframes.
Signal Generation: Determines buy and sell signals based on whether the current EMA is above or below the EMA from 30 bars ago.
Table Display: Presents the signals in a table at the bottom-right of the chart, showing whether to buy, sell, or hold for each timeframe.
Usage Instructions:
Apply the Indicator: Add the script to your TradingView chart.
Review Signals: Observe the table to understand the current trend for each timeframe.
Adjust Settings: Customize the EMA lengths if needed to fit your trading strategy.
Example Chart:
Ensure your chart is clean, showing only the indicator table without additional clutter. The table should clearly reflect the current buy, sell, or neutral status based on the EMA calculations.
Disclaimer: This indicator is a tool for analysis and should be used in conjunction with other indicators and market research. Always test with historical data before applying it to live trading.
오픈 소스 스크립트
트레이딩뷰의 진정한 정신에 따라, 이 스크립트의 작성자는 이를 오픈소스로 공개하여 트레이더들이 기능을 검토하고 검증할 수 있도록 했습니다. 작성자에게 찬사를 보냅니다! 이 코드는 무료로 사용할 수 있지만, 코드를 재게시하는 경우 하우스 룰이 적용된다는 점을 기억하세요.
면책사항
해당 정보와 게시물은 금융, 투자, 트레이딩 또는 기타 유형의 조언이나 권장 사항으로 간주되지 않으며, 트레이딩뷰에서 제공하거나 보증하는 것이 아닙니다. 자세한 내용은 이용 약관을 참조하세요.
오픈 소스 스크립트
트레이딩뷰의 진정한 정신에 따라, 이 스크립트의 작성자는 이를 오픈소스로 공개하여 트레이더들이 기능을 검토하고 검증할 수 있도록 했습니다. 작성자에게 찬사를 보냅니다! 이 코드는 무료로 사용할 수 있지만, 코드를 재게시하는 경우 하우스 룰이 적용된다는 점을 기억하세요.
면책사항
해당 정보와 게시물은 금융, 투자, 트레이딩 또는 기타 유형의 조언이나 권장 사항으로 간주되지 않으며, 트레이딩뷰에서 제공하거나 보증하는 것이 아닙니다. 자세한 내용은 이용 약관을 참조하세요.