OPEN-SOURCE SCRIPT
업데이트됨 Speculation Ratio Territory
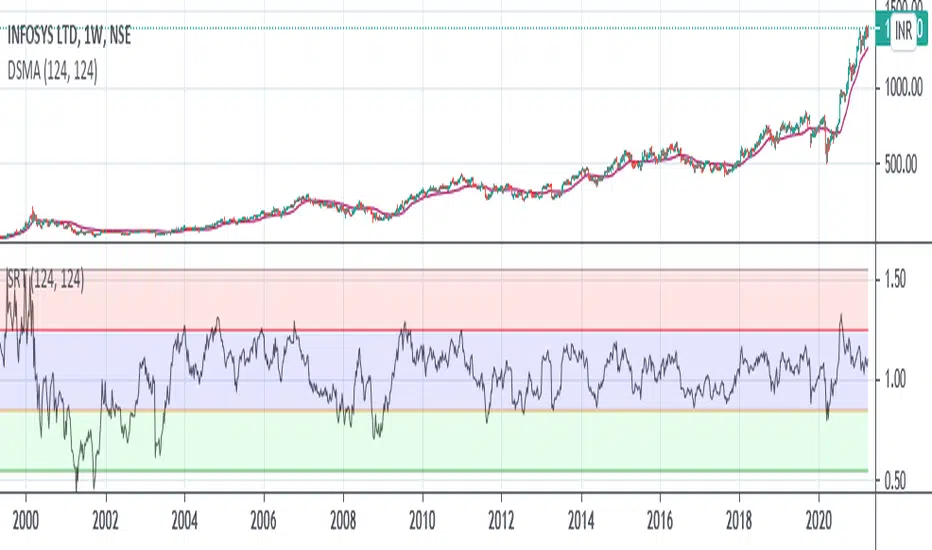
Speculation Ratio Territory
It is used to find the Index Top or Bottom which will define the buying and selling zone.
It should be checked on a weekly chart.
Example : As Nifty Trades around 248 days in a year.
So, 248/2 = 124
Now Use 124 DSMA on weekly chart.
Suppose Nifty 124 DSMA is @16000 and Current Market Price is 16500, then
SRT = 16500/16000 = 1.031
Top SRT of Nifty = 1.55
Bottom SRT of Nifty = 0.55
One should start investing when SRT value is between 0.55 to 0.75
And exit when SRT value is between 1.30 to 1.55
Credit for DSMA Script : //Deviation Scaled Moving Average by John Ehlers
It is used to find the Index Top or Bottom which will define the buying and selling zone.
It should be checked on a weekly chart.
Example : As Nifty Trades around 248 days in a year.
So, 248/2 = 124
Now Use 124 DSMA on weekly chart.
Suppose Nifty 124 DSMA is @16000 and Current Market Price is 16500, then
SRT = 16500/16000 = 1.031
Top SRT of Nifty = 1.55
Bottom SRT of Nifty = 0.55
One should start investing when SRT value is between 0.55 to 0.75
And exit when SRT value is between 1.30 to 1.55
- 0.55 to 0.75 --> ENTER (Green Zone)
- 0.75 to 1.30 --> HOLD (Blue Zone)
- 1.30 to 1.55 --> EXIT (Red Zone)
Credit for DSMA Script : //Deviation Scaled Moving Average by John Ehlers
릴리즈 노트
Update : The concept of SRT is inspired by nkstocktalk , you can find the SRT details here as well : twitter.com"/"NKStockTalk1"/"status"/"1378537449010327553오픈 소스 스크립트
트레이딩뷰의 진정한 정신에 따라, 이 스크립트의 작성자는 이를 오픈소스로 공개하여 트레이더들이 기능을 검토하고 검증할 수 있도록 했습니다. 작성자에게 찬사를 보냅니다! 이 코드는 무료로 사용할 수 있지만, 코드를 재게시하는 경우 하우스 룰이 적용된다는 점을 기억하세요.
면책사항
해당 정보와 게시물은 금융, 투자, 트레이딩 또는 기타 유형의 조언이나 권장 사항으로 간주되지 않으며, 트레이딩뷰에서 제공하거나 보증하는 것이 아닙니다. 자세한 내용은 이용 약관을 참조하세요.
오픈 소스 스크립트
트레이딩뷰의 진정한 정신에 따라, 이 스크립트의 작성자는 이를 오픈소스로 공개하여 트레이더들이 기능을 검토하고 검증할 수 있도록 했습니다. 작성자에게 찬사를 보냅니다! 이 코드는 무료로 사용할 수 있지만, 코드를 재게시하는 경우 하우스 룰이 적용된다는 점을 기억하세요.
면책사항
해당 정보와 게시물은 금융, 투자, 트레이딩 또는 기타 유형의 조언이나 권장 사항으로 간주되지 않으며, 트레이딩뷰에서 제공하거나 보증하는 것이 아닙니다. 자세한 내용은 이용 약관을 참조하세요.