OPEN-SOURCE SCRIPT
Old Price Oscillator

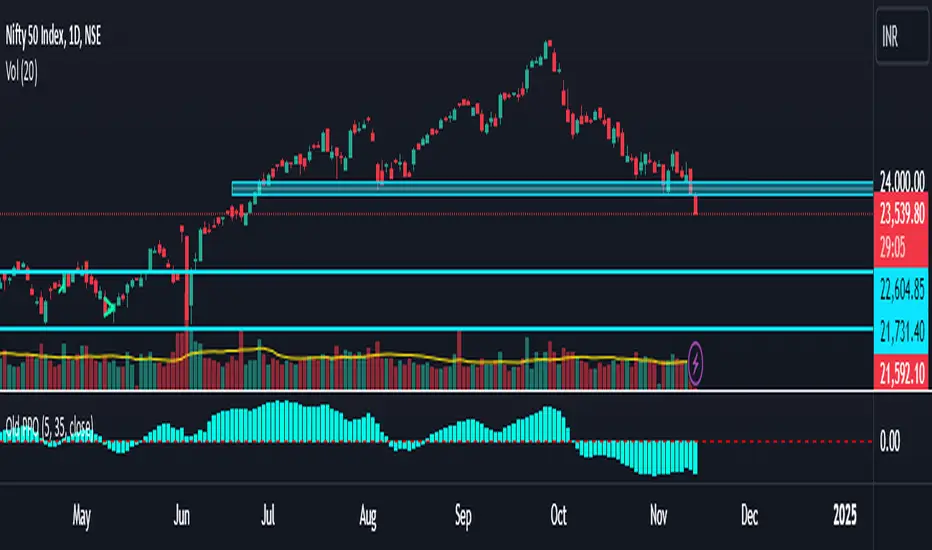
The Old Price Oscillator (OPO) is a momentum indicator widely used by traders and analysts to gauge the direction and strength of price trends. It works by calculating the difference between two moving averages—a shorter-term moving average and a longer-term moving average—of a security’s price. This difference is plotted as an oscillating line, helping traders visualize the momentum and determine when price reversals or continuations might occur. Typically, when the oscillator value is positive, the price is trending upwards, suggesting potential buy signals; conversely, when the oscillator turns negative, it indicates downward momentum, which could signal a potential sell.
The OPO is similar to other oscillators, like the Moving Average Convergence Divergence (MACD), in that it uses moving averages to smooth out price fluctuations and clarify trends. Traders often customize the length of the short- and long-term moving averages to better suit specific assets or market conditions. Generally, this indicator is especially useful in markets that exhibit clear trends. However, it may generate false signals during sideways or highly volatile periods, so many traders combine the OPO with other technical indicators or filters to improve accuracy.
The OPO is similar to other oscillators, like the Moving Average Convergence Divergence (MACD), in that it uses moving averages to smooth out price fluctuations and clarify trends. Traders often customize the length of the short- and long-term moving averages to better suit specific assets or market conditions. Generally, this indicator is especially useful in markets that exhibit clear trends. However, it may generate false signals during sideways or highly volatile periods, so many traders combine the OPO with other technical indicators or filters to improve accuracy.
오픈 소스 스크립트
트레이딩뷰의 진정한 정신에 따라, 이 스크립트의 작성자는 이를 오픈소스로 공개하여 트레이더들이 기능을 검토하고 검증할 수 있도록 했습니다. 작성자에게 찬사를 보냅니다! 이 코드는 무료로 사용할 수 있지만, 코드를 재게시하는 경우 하우스 룰이 적용된다는 점을 기억하세요.
면책사항
해당 정보와 게시물은 금융, 투자, 트레이딩 또는 기타 유형의 조언이나 권장 사항으로 간주되지 않으며, 트레이딩뷰에서 제공하거나 보증하는 것이 아닙니다. 자세한 내용은 이용 약관을 참조하세요.
오픈 소스 스크립트
트레이딩뷰의 진정한 정신에 따라, 이 스크립트의 작성자는 이를 오픈소스로 공개하여 트레이더들이 기능을 검토하고 검증할 수 있도록 했습니다. 작성자에게 찬사를 보냅니다! 이 코드는 무료로 사용할 수 있지만, 코드를 재게시하는 경우 하우스 룰이 적용된다는 점을 기억하세요.
면책사항
해당 정보와 게시물은 금융, 투자, 트레이딩 또는 기타 유형의 조언이나 권장 사항으로 간주되지 않으며, 트레이딩뷰에서 제공하거나 보증하는 것이 아닙니다. 자세한 내용은 이용 약관을 참조하세요.