OPEN-SOURCE SCRIPT
업데이트됨 Trendlines Strategy
Using the clever calculations and code by BacktestRookies, here is a strategy that buys
when the price breaks above the trend line and sells (or shorts) when it crosses below.
This logic can be reversed, which seems to work better with recent market conditions.
when the price breaks above the trend line and sells (or shorts) when it crosses below.
This logic can be reversed, which seems to work better with recent market conditions.
릴리즈 노트
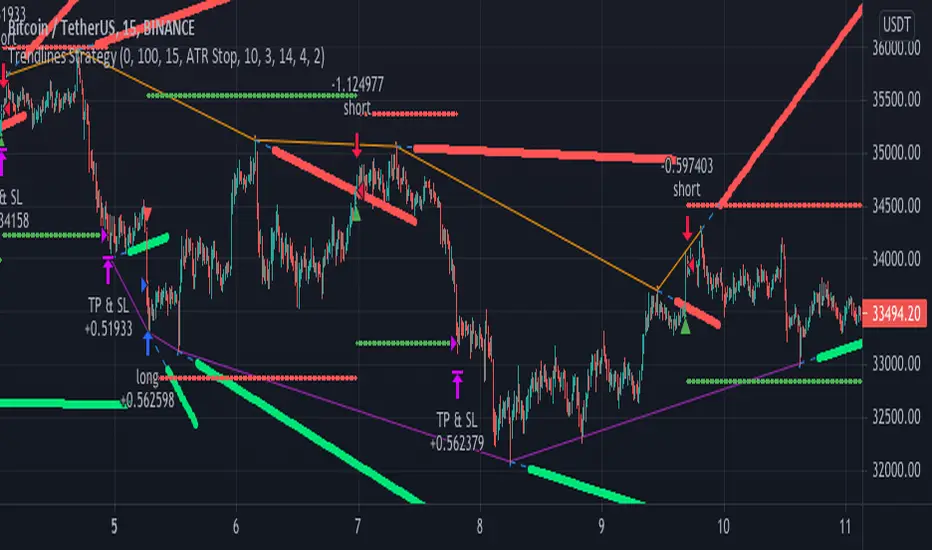
"A general explanation of the indicator would be a good place to start. In it, we plot two trend lines at any given time. A resistance trend line and a support trend line. The resistance trend is shown with red circles and is created by joining swing highs together. The second is a support trend which is created by joining swing lows.Since we need swings to make the trend, the trend line code contains code for the swing detection. You can play around with the swing detection to alter how frequently new trend lines are detected. Relying on swings also means that there will be some delay in trend detection depending on how you configure the swing detection. The higher you set rightbars, the more lag you will have before a trend is detected. However, at the same time the quality of the pivots found will increase. So it is a trade-off you need to come to terms with and decide what the best settings are for you.
A single trend line is made up of several components.
Pivot Points: Marked as blue or orange circles. There will be two pivots per trend.
Orange/Purple Lines: Connecting all pivot points. You will see these lines change direction slightly each time a new pivot is detected (new circles appear).
Green/Red Circle lines: Showing the trend line from the earliest moment a new trend is detected.
Blue Dashed lines: Joining the purple and green/red circle lines so the full trend line can be seen.
Note: The blue dashed lines use pine-scripts drawing functions. As such, there is a limit to how many of these can be placed on a chart. When the limit is reached, the oldest line will be removed so the newest can be drawn. This means that if you detect enough trends and scroll back in time, the blue dashed lines will disappear at some point!"
오픈 소스 스크립트
트레이딩뷰의 진정한 정신에 따라, 이 스크립트의 작성자는 이를 오픈소스로 공개하여 트레이더들이 기능을 검토하고 검증할 수 있도록 했습니다. 작성자에게 찬사를 보냅니다! 이 코드는 무료로 사용할 수 있지만, 코드를 재게시하는 경우 하우스 룰이 적용된다는 점을 기억하세요.
면책사항
해당 정보와 게시물은 금융, 투자, 트레이딩 또는 기타 유형의 조언이나 권장 사항으로 간주되지 않으며, 트레이딩뷰에서 제공하거나 보증하는 것이 아닙니다. 자세한 내용은 이용 약관을 참조하세요.
오픈 소스 스크립트
트레이딩뷰의 진정한 정신에 따라, 이 스크립트의 작성자는 이를 오픈소스로 공개하여 트레이더들이 기능을 검토하고 검증할 수 있도록 했습니다. 작성자에게 찬사를 보냅니다! 이 코드는 무료로 사용할 수 있지만, 코드를 재게시하는 경우 하우스 룰이 적용된다는 점을 기억하세요.
면책사항
해당 정보와 게시물은 금융, 투자, 트레이딩 또는 기타 유형의 조언이나 권장 사항으로 간주되지 않으며, 트레이딩뷰에서 제공하거나 보증하는 것이 아닙니다. 자세한 내용은 이용 약관을 참조하세요.