OPEN-SOURCE SCRIPT
25-Day Momentum Index
Description:
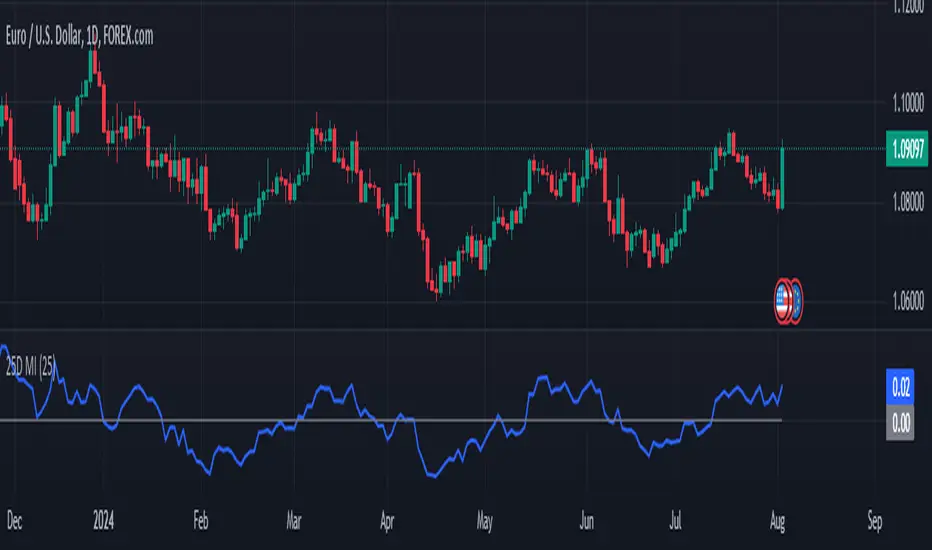
The 25-Day Momentum Index (25D MI) is a technical indicator designed to measure the strength and direction of price movements over a 25-day period. Inspired by classic momentum analysis, this indicator helps traders identify trends and potential reversal points in the market.
How It Works:
Momentum Calculation: The 25D MI calculates momentum as the difference between the current closing price and the closing price 25 days ago. This difference provides insights into the market's recent strength or weakness.
Plotting: The indicator plots the Momentum Index as a blue line, showing the raw momentum values. A zero line is also plotted in gray to serve as a reference point for positive and negative momentum.
Highlighting Zones:
Positive Momentum: When the Momentum Index is above zero, it is plotted in green, highlighting positive momentum phases.
Negative Momentum: When the Momentum Index is below zero, it is plotted in red, highlighting negative momentum phases.
Usage:
A rising curve means an increase in upward momentum - if it is above the zero line. A rising curve below the zero line signifies a decrease in downward momentum. By the same token, a falling curve means an increase in downward momentum below the zero line, a decrease in upward momentum above the zero line.
This indicator is ideal for traders looking to complement their strategy with a visual tool that captures the essence of market momentum over a significant period. Use it to enhance your technical analysis and refine your trading decisions.
오픈 소스 스크립트
트레이딩뷰의 진정한 정신에 따라, 이 스크립트의 작성자는 이를 오픈소스로 공개하여 트레이더들이 기능을 검토하고 검증할 수 있도록 했습니다. 작성자에게 찬사를 보냅니다! 이 코드는 무료로 사용할 수 있지만, 코드를 재게시하는 경우 하우스 룰이 적용된다는 점을 기억하세요.
면책사항
해당 정보와 게시물은 금융, 투자, 트레이딩 또는 기타 유형의 조언이나 권장 사항으로 간주되지 않으며, 트레이딩뷰에서 제공하거나 보증하는 것이 아닙니다. 자세한 내용은 이용 약관을 참조하세요.
오픈 소스 스크립트
트레이딩뷰의 진정한 정신에 따라, 이 스크립트의 작성자는 이를 오픈소스로 공개하여 트레이더들이 기능을 검토하고 검증할 수 있도록 했습니다. 작성자에게 찬사를 보냅니다! 이 코드는 무료로 사용할 수 있지만, 코드를 재게시하는 경우 하우스 룰이 적용된다는 점을 기억하세요.
면책사항
해당 정보와 게시물은 금융, 투자, 트레이딩 또는 기타 유형의 조언이나 권장 사항으로 간주되지 않으며, 트레이딩뷰에서 제공하거나 보증하는 것이 아닙니다. 자세한 내용은 이용 약관을 참조하세요.