OPEN-SOURCE SCRIPT
4 Bar Fractal
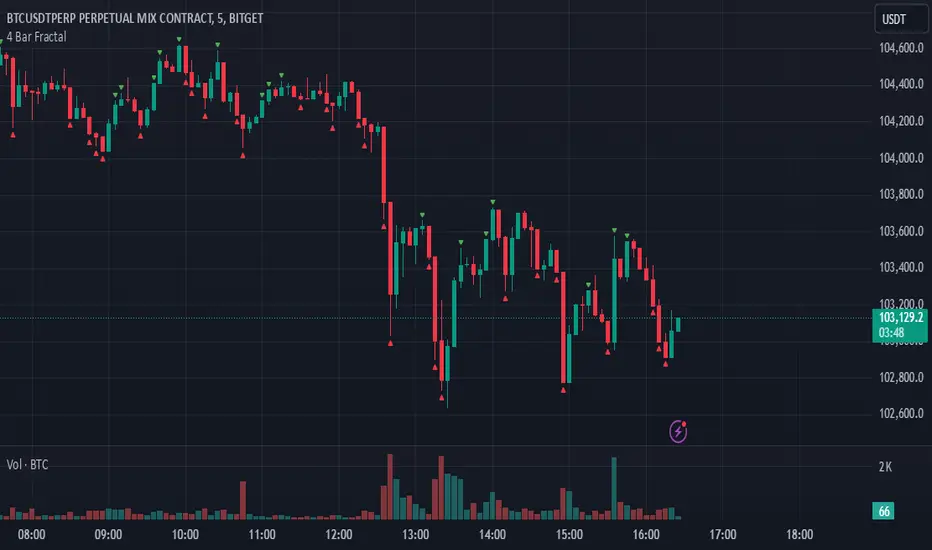
This indicator is a simple yet powerful tool that tracks potential trend reversals by checking whether the closing price of the last candle in a four-candle sequence finishes above or below the highs or lows of both the immediately preceding candle and the first candle in that sequence. If the closing price breaks above those prior highs, a green triangle appears above the chart to indicate bullish momentum; if it breaks below those lows, a red triangle appears below the chart to signal bearish momentum. Not only is it beneficial for scalping or other short-term trading, but it also works well for swing trades and longer-term trends, making it one of the most effective indicators for catching significant market shifts. However, to avoid false breakouts, it is advisable to confirm signals with volume or additional trend indicators and to maintain disciplined risk management.
오픈 소스 스크립트
트레이딩뷰의 진정한 정신에 따라, 이 스크립트의 작성자는 이를 오픈소스로 공개하여 트레이더들이 기능을 검토하고 검증할 수 있도록 했습니다. 작성자에게 찬사를 보냅니다! 이 코드는 무료로 사용할 수 있지만, 코드를 재게시하는 경우 하우스 룰이 적용된다는 점을 기억하세요.
면책사항
해당 정보와 게시물은 금융, 투자, 트레이딩 또는 기타 유형의 조언이나 권장 사항으로 간주되지 않으며, 트레이딩뷰에서 제공하거나 보증하는 것이 아닙니다. 자세한 내용은 이용 약관을 참조하세요.
오픈 소스 스크립트
트레이딩뷰의 진정한 정신에 따라, 이 스크립트의 작성자는 이를 오픈소스로 공개하여 트레이더들이 기능을 검토하고 검증할 수 있도록 했습니다. 작성자에게 찬사를 보냅니다! 이 코드는 무료로 사용할 수 있지만, 코드를 재게시하는 경우 하우스 룰이 적용된다는 점을 기억하세요.
면책사항
해당 정보와 게시물은 금융, 투자, 트레이딩 또는 기타 유형의 조언이나 권장 사항으로 간주되지 않으며, 트레이딩뷰에서 제공하거나 보증하는 것이 아닙니다. 자세한 내용은 이용 약관을 참조하세요.