PROTECTED SOURCE SCRIPT
업데이트됨 Adaptive Donchian Lines
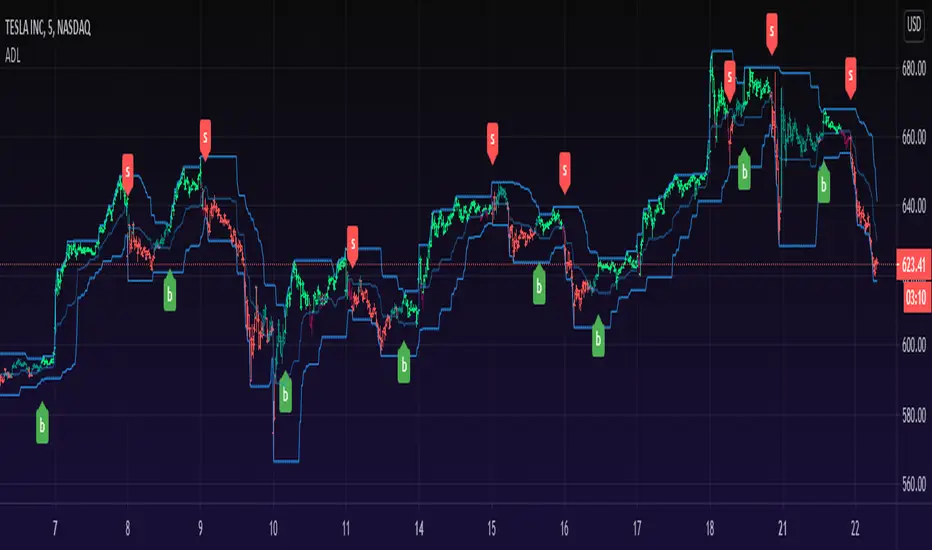
The Adaptive Donchian plots a line based on the average of the lowest low and highest high. I call it 'ADL'.
Maximum/Minimum lookback period defines the range where the adaptive length can move.
When the asset velocity increases the indicator shortens its lookback period.
When the asset velocity decreases the indicator lengthens its lookback period.
The higher value 'Percent of change' is, the more adaptive it will be, hench, Adaptive Donchian sensitivity increases to velocity changes.
You can select from two different types of signals "Above or Below Middle Line" and "Touching Bands".
"Above or Below Middle Line" gives a Buy signal if LOW is crossing over the middle line and Sell signal if HIGH is crossing under the middle line.
"Touching Bands" gives Buy signal if HIGH touches the upper band and Sell signal if LOW touches the lower band.
== Color for "Touching Bands" ==
Green: Low is above center line - Up trending.
Lighter Green: Close is above center line but Low is still below H/L line - Weaker up trend.
Red: High is below center line - Down trending.
Lighter Red: Close is below the center line but High is still above H/L line - Weaker down trend.
== Color for "Above or Below Middle Line" ==
Green: Low is above center line - Up trending.
Red: High is below center line - Down trending.
== Notes ==
Bar coloring is disabled by default.
Middle line can also act as a stop loss.
Like if you like and Enjoy!
Code is currently closed as it needs more cleaning and updates.
Feel free to comment and Follow to stay updated with upcoming scripts: tradingview.com/u/dman103
릴리즈 노트
Added alerts.릴리즈 노트
Better description for alerts.보호된 스크립트입니다
이 스크립트는 비공개 소스로 게시됩니다. 하지만 이를 자유롭게 제한 없이 사용할 수 있습니다 – 자세한 내용은 여기에서 확인하세요.
Appreciation of my work: paypal.me/dman103
All Premium indicators: algo.win
LIVE Stream - Pivot Points Algo: youtube.com/channel/UCFyqab-i0xb2jf-c18ufH0A/live
All Premium indicators: algo.win
LIVE Stream - Pivot Points Algo: youtube.com/channel/UCFyqab-i0xb2jf-c18ufH0A/live
면책사항
해당 정보와 게시물은 금융, 투자, 트레이딩 또는 기타 유형의 조언이나 권장 사항으로 간주되지 않으며, 트레이딩뷰에서 제공하거나 보증하는 것이 아닙니다. 자세한 내용은 이용 약관을 참조하세요.
보호된 스크립트입니다
이 스크립트는 비공개 소스로 게시됩니다. 하지만 이를 자유롭게 제한 없이 사용할 수 있습니다 – 자세한 내용은 여기에서 확인하세요.
Appreciation of my work: paypal.me/dman103
All Premium indicators: algo.win
LIVE Stream - Pivot Points Algo: youtube.com/channel/UCFyqab-i0xb2jf-c18ufH0A/live
All Premium indicators: algo.win
LIVE Stream - Pivot Points Algo: youtube.com/channel/UCFyqab-i0xb2jf-c18ufH0A/live
면책사항
해당 정보와 게시물은 금융, 투자, 트레이딩 또는 기타 유형의 조언이나 권장 사항으로 간주되지 않으며, 트레이딩뷰에서 제공하거나 보증하는 것이 아닙니다. 자세한 내용은 이용 약관을 참조하세요.