OPEN-SOURCE SCRIPT
업데이트됨 MOEX Sectors: % Above MA 50/100/200 (EMA/SMA)
🧠 Name:
MOEX Sectors: % Above MA 50/100/200 (EMA/SMA)
📋 Description (for TradingView “Description” tab):
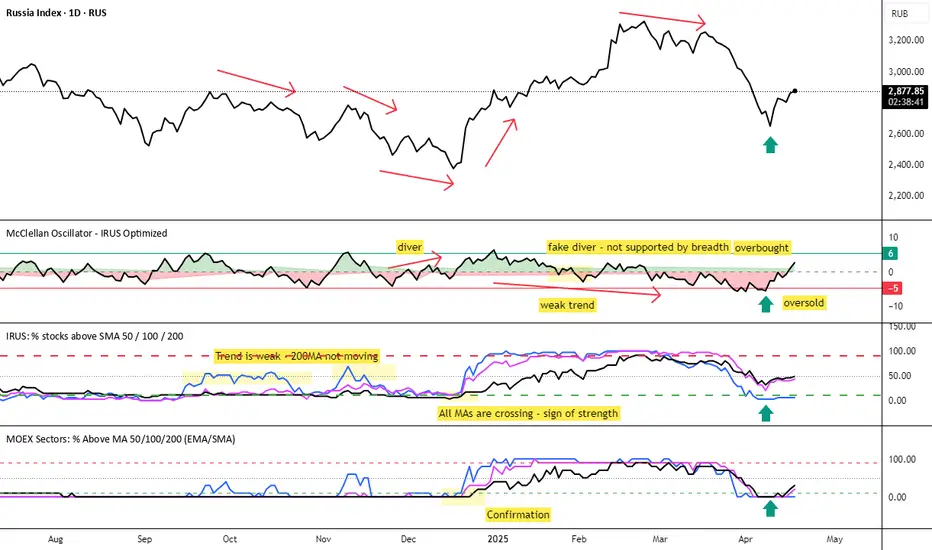
This indicator shows the percentage of Moscow Exchange sectoral indices trading above the selected moving average (SMA or EMA) with periods of 50, 100, or 200.
It uses 10 official MOEX sector indices:
MOEXOG (Oil & Gas)
MOEXCH (Chemicals)
MOEXMM (Metals & Mining)
MOEXTN (Transport)
MOEXCN (Consumer)
MOEXFN (Financials)
MOEXTL (Telecom)
MOEXEU (Utilities)
MOEXIT (IT)
MOEXRE (Real Estate)
The indicator plots up to 3 lines representing the % of sectors trading above MA 50, 100, and/or 200. The MA type is user-selectable: EMA (default) or SMA.
Horizontal reference levels (90, 50, 10) help interpret market conditions:
🔼 >90% — Overbought zone, potential market exhaustion
⚖️ ~50% — Neutral state
🔽 <10% — Oversold zone, possible rebound
📈 How to Use in Strategy:
✅ 1. Trend Filter
If >50% of sectors are above MA 200 → market in long-term uptrend
If <50% → avoid long bias, bearish regime likely
✅ 2. Bottom Detection
When <10% of sectors are above MA 200, the market is heavily oversold — often a bottoming signal
✅ 3. Trend Confirmation
If the main index is rising and % of sectors above MA is growing, the trend is supported by breadth
If the index rises while breadth declines → bearish divergence
✅ 4. Contrarian Setups
>90% of sectors above MA 50 → market may be overheated, watch for pullback
<20% above MA 50 → potential local bottom
⚙️ Tips:
Overlay this indicator on the IMOEX index chart to detect narrow leadership
Combine with other breadth metrics or RSI on the index
Use the EMA/SMA toggle to fine-tune sensitivity
MOEX Sectors: % Above MA 50/100/200 (EMA/SMA)
📋 Description (for TradingView “Description” tab):
This indicator shows the percentage of Moscow Exchange sectoral indices trading above the selected moving average (SMA or EMA) with periods of 50, 100, or 200.
It uses 10 official MOEX sector indices:
MOEXOG (Oil & Gas)
MOEXCH (Chemicals)
MOEXMM (Metals & Mining)
MOEXTN (Transport)
MOEXCN (Consumer)
MOEXFN (Financials)
MOEXTL (Telecom)
MOEXEU (Utilities)
MOEXIT (IT)
MOEXRE (Real Estate)
The indicator plots up to 3 lines representing the % of sectors trading above MA 50, 100, and/or 200. The MA type is user-selectable: EMA (default) or SMA.
Horizontal reference levels (90, 50, 10) help interpret market conditions:
🔼 >90% — Overbought zone, potential market exhaustion
⚖️ ~50% — Neutral state
🔽 <10% — Oversold zone, possible rebound
📈 How to Use in Strategy:
✅ 1. Trend Filter
If >50% of sectors are above MA 200 → market in long-term uptrend
If <50% → avoid long bias, bearish regime likely
✅ 2. Bottom Detection
When <10% of sectors are above MA 200, the market is heavily oversold — often a bottoming signal
✅ 3. Trend Confirmation
If the main index is rising and % of sectors above MA is growing, the trend is supported by breadth
If the index rises while breadth declines → bearish divergence
✅ 4. Contrarian Setups
>90% of sectors above MA 50 → market may be overheated, watch for pullback
<20% above MA 50 → potential local bottom
⚙️ Tips:
Overlay this indicator on the IMOEX index chart to detect narrow leadership
Combine with other breadth metrics or RSI on the index
Use the EMA/SMA toggle to fine-tune sensitivity
릴리즈 노트
📝 This indicator tracks market breadth across sector indices of the Moscow Exchange (MOEX). It calculates the percentage of sectors trading above selected moving averages (SMA or EMA) with user-defined periods (50, 100, or 200).It provides a high-level view of market participation and internal strength, helping to identify broad trends, divergences, and potential reversals.
📦 Tracked MOEX Sector Indices:
mathematica
Copy
Edit
MOEXOG — Oil & Gas
MOEXCH — Chemicals
MOEXMM — Metals & Mining
MOEXTN — Transport
MOEXCN — Consumer
MOEXFN — Financials
MOEXTL — Telecom
MOEXEU — Utilities
MOEXIT — Information Technology
MOEXRE — Real Estate
📈 How to Use:
>50% above MA 200 → Bullish market regime
<50% above MA 200 → Weak breadth, caution advised
>90% above MA 50 → Market may be overbought
<10% above MA 200 → Market oversold, possible bottom
Combine with the IMOEX index to assess participation behind major moves
Use as a trend filter or divergence detector
오픈 소스 스크립트
트레이딩뷰의 진정한 정신에 따라, 이 스크립트의 작성자는 이를 오픈소스로 공개하여 트레이더들이 기능을 검토하고 검증할 수 있도록 했습니다. 작성자에게 찬사를 보냅니다! 이 코드는 무료로 사용할 수 있지만, 코드를 재게시하는 경우 하우스 룰이 적용된다는 점을 기억하세요.
면책사항
해당 정보와 게시물은 금융, 투자, 트레이딩 또는 기타 유형의 조언이나 권장 사항으로 간주되지 않으며, 트레이딩뷰에서 제공하거나 보증하는 것이 아닙니다. 자세한 내용은 이용 약관을 참조하세요.
오픈 소스 스크립트
트레이딩뷰의 진정한 정신에 따라, 이 스크립트의 작성자는 이를 오픈소스로 공개하여 트레이더들이 기능을 검토하고 검증할 수 있도록 했습니다. 작성자에게 찬사를 보냅니다! 이 코드는 무료로 사용할 수 있지만, 코드를 재게시하는 경우 하우스 룰이 적용된다는 점을 기억하세요.
면책사항
해당 정보와 게시물은 금융, 투자, 트레이딩 또는 기타 유형의 조언이나 권장 사항으로 간주되지 않으며, 트레이딩뷰에서 제공하거나 보증하는 것이 아닙니다. 자세한 내용은 이용 약관을 참조하세요.