PROTECTED SOURCE SCRIPT
Point of Control + Momentum Candles
POINT OF CONTROL + MOMENTUM CANDLES
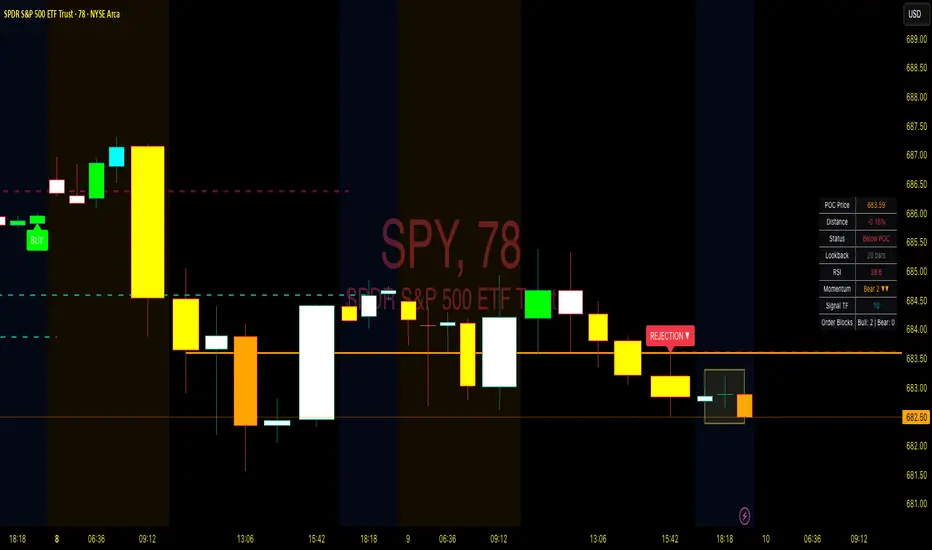
A multi-feature indicator combining volume-based POC detection, 6-level momentum candle coloring, higher timeframe buy/sell signals, and order block identification.
FEATURES
Point of Control (POC)
Calculates the price level with highest traded volume over a customizable lookback period. Includes break and rejection detection with visual signals.
Momentum Candle Coloring
Colors candles based on EMA positioning and RSI values across 6 momentum levels:
- Bull 3/2/1: Strong to weak bullish momentum (Blue/Cyan/Green)
- Bear 1/2/3: Weak to strong bearish momentum (Yellow/Orange/Red)
- Neutral: No clear momentum (White)
Buy/Sell Signals
Generates signals from a user-selectable timeframe using EMA crossovers and RSI conditions. Signals appear on your current chart for multi-timeframe analysis.
Order Blocks
Detects potential institutional entry zones:
- Bullish OB: Last bearish candle before bullish impulse
- Bearish OB: Last bullish candle before bearish impulse
Blocks extend forward and optionally delete when mitigated.
Dashboard
Displays POC price, distance, RSI, momentum level, signal timeframe, and active order block count.
ALERTS
10 conditions available: POC breaks, rejections, buy/sell signals, and order block formations.
HOW TO USE
- Trade POC breaks for trend continuation
- Trade POC rejections for reversals
- Use candle colors to gauge momentum strength
- Confirm entries with higher timeframe signals
- Watch for price returning to order blocks
SETTINGS
All parameters are fully customizable including lookback periods, thresholds, timeframes, colors, and visual styles.
DISCLAIMER
For educational purposes only. Not financial advice. Trading involves risk. Always conduct your own analysis before making trading decisions.
보호된 스크립트입니다
이 스크립트는 비공개 소스로 게시됩니다. 하지만 이를 자유롭게 제한 없이 사용할 수 있습니다 – 자세한 내용은 여기에서 확인하세요.
MARK N. ROGERS, MBA
Rogers1906.com
Rogers1906.com
면책사항
해당 정보와 게시물은 금융, 투자, 트레이딩 또는 기타 유형의 조언이나 권장 사항으로 간주되지 않으며, 트레이딩뷰에서 제공하거나 보증하는 것이 아닙니다. 자세한 내용은 이용 약관을 참조하세요.
보호된 스크립트입니다
이 스크립트는 비공개 소스로 게시됩니다. 하지만 이를 자유롭게 제한 없이 사용할 수 있습니다 – 자세한 내용은 여기에서 확인하세요.
MARK N. ROGERS, MBA
Rogers1906.com
Rogers1906.com
면책사항
해당 정보와 게시물은 금융, 투자, 트레이딩 또는 기타 유형의 조언이나 권장 사항으로 간주되지 않으며, 트레이딩뷰에서 제공하거나 보증하는 것이 아닙니다. 자세한 내용은 이용 약관을 참조하세요.