OPEN-SOURCE SCRIPT
Multi-Signal Indikator
Hier ist eine professionelle Beschreibung für deinen Indikator auf Englisch:
Multi-Signal Trading Indicator - Complete Market Analysis
This comprehensive trading indicator combines multiple technical analysis tools into one powerful dashboard, providing traders with all essential market information at a glance.
Key Features:
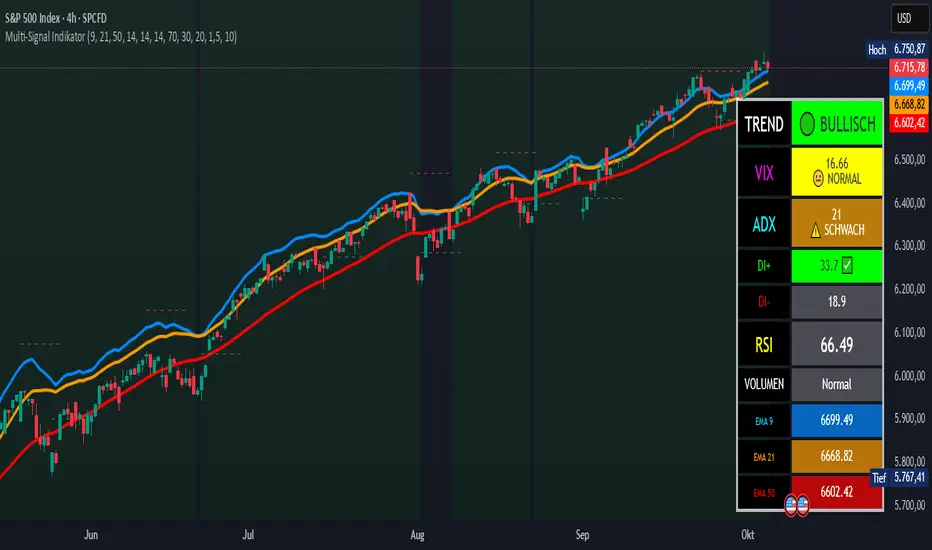
Trend Analysis: Three EMAs (9, 21, 50) with automatic trend detection and Golden/Death Cross signals
Momentum Indicators: RSI with overbought/oversold zones and visual alerts
Trend Strength: ADX indicator with DI+ and DI- showing the power of bullish and bearish movements
Market Fear Gauge: VIX (Volatility Index) integration displaying market sentiment from calm to panic levels
Volume Confirmation: Smart volume analysis comparing current activity against 20-period average
Support & Resistance: Automatic pivot point detection with dynamic S/R lines
Buy/Sell Signals: Combined signals only trigger when trend, RSI, and volume align perfectly
Visual Dashboard: Color-coded info panel showing all metrics in real-time with intuitive emoji indicators
Perfect for: Day traders, swing traders, and investors who want a complete market overview without cluttering their charts with multiple indicators.
Customizable settings allow you to adjust all parameters to match your trading style.
Multi-Signal Trading Indicator - Complete Market Analysis
This comprehensive trading indicator combines multiple technical analysis tools into one powerful dashboard, providing traders with all essential market information at a glance.
Key Features:
Trend Analysis: Three EMAs (9, 21, 50) with automatic trend detection and Golden/Death Cross signals
Momentum Indicators: RSI with overbought/oversold zones and visual alerts
Trend Strength: ADX indicator with DI+ and DI- showing the power of bullish and bearish movements
Market Fear Gauge: VIX (Volatility Index) integration displaying market sentiment from calm to panic levels
Volume Confirmation: Smart volume analysis comparing current activity against 20-period average
Support & Resistance: Automatic pivot point detection with dynamic S/R lines
Buy/Sell Signals: Combined signals only trigger when trend, RSI, and volume align perfectly
Visual Dashboard: Color-coded info panel showing all metrics in real-time with intuitive emoji indicators
Perfect for: Day traders, swing traders, and investors who want a complete market overview without cluttering their charts with multiple indicators.
Customizable settings allow you to adjust all parameters to match your trading style.
오픈 소스 스크립트
트레이딩뷰의 진정한 정신에 따라, 이 스크립트의 작성자는 이를 오픈소스로 공개하여 트레이더들이 기능을 검토하고 검증할 수 있도록 했습니다. 작성자에게 찬사를 보냅니다! 이 코드는 무료로 사용할 수 있지만, 코드를 재게시하는 경우 하우스 룰이 적용된다는 점을 기억하세요.
면책사항
해당 정보와 게시물은 금융, 투자, 트레이딩 또는 기타 유형의 조언이나 권장 사항으로 간주되지 않으며, 트레이딩뷰에서 제공하거나 보증하는 것이 아닙니다. 자세한 내용은 이용 약관을 참조하세요.
오픈 소스 스크립트
트레이딩뷰의 진정한 정신에 따라, 이 스크립트의 작성자는 이를 오픈소스로 공개하여 트레이더들이 기능을 검토하고 검증할 수 있도록 했습니다. 작성자에게 찬사를 보냅니다! 이 코드는 무료로 사용할 수 있지만, 코드를 재게시하는 경우 하우스 룰이 적용된다는 점을 기억하세요.
면책사항
해당 정보와 게시물은 금융, 투자, 트레이딩 또는 기타 유형의 조언이나 권장 사항으로 간주되지 않으며, 트레이딩뷰에서 제공하거나 보증하는 것이 아닙니다. 자세한 내용은 이용 약관을 참조하세요.